MySQL监控利器-Innotop
来源:互联网 发布:用ps淘宝详情页怎么做 编辑:程序博客网 时间:2024/04/19 07:52
Innotop是一款十分强大的MySQL监控工具,用perl所写,通过文本模式展示MysQL服务器和Innodb的运行状况。
安装依赖:
#perl -MCPAN -e shell
cpan>install YAML
cpan>install DBI
cpan>install DBD::mysql
cpan>install CGI
CPAN> install Time::HiRes
CPAN> install Term::ReadKey
连接命令: innotop -uroot -proot -d 1
安装innotop
下载地址:https://github.com/innotop/innotop
Github上提供两种版本,一种是开发版(innotop-master),一种是稳定版(innotop-gtid)。在这里,我们使用的是开发版。
注意:网上提供的下载地址是http://code.google.com/p/innotop/,但这个是原先的维护地址,该项目现已迁移到Github上,而且,innotop-1.9.0.tar.gz这个版本也测试了下(google code上面的最新版本是1.9.1),很多功能都无法使用,可能与MySQL的版本有关,建议还是直接从Github上下载。
# unzip innotop-master.zip
# cd innotop-master
# perl Makefile.PL
Checking if your kit is complete...Looks goodWarning: prerequisite Term::ReadKey 2.1 not found.Writing Makefile for innotop报以上错误,缺少ReadKey包。
# yum search ReadKey --注意:基本上缺失的Perl Module都可以通常yum获取

Loaded plugins: fastestmirrorLoading mirror speeds from cached hostfile * base: centos.ustc.edu.cn * extras: centos.ustc.edu.cn * updates: centos.ustc.edu.cn================================================= N/S matched: ReadKey ==================================================perl-TermReadKey.x86_64 : A perl module for simple terminal control Name and summary matches only, use "search all" for everything.# yum install -y perl-TermReadKey
# perl Makefile.PL
Writing Makefile for innotop# make install
cp innotop blib/script/innotop/usr/bin/perl -MExtUtils::MY -e 'MY->fixin(shift)' -- blib/script/innotopManifying blib/man1/innotop.1Installing /usr/local/share/man/man1/innotop.1Installing /usr/local/bin/innotopAppending installation info to /usr/lib64/perl5/perllocal.pod
如何使用Innotop
首先我们通过innotop --help查看其常见的启动参数
# innotop --helpUsage: innotop <options> <innodb-status-file> --[no]color -C Use terminal coloring (default) --config -c Config file to read --count Number of updates before exiting --delay -d Delay between updates in seconds --help Show this help message --host -h Connect to host --[no]inc -i Measure incremental differences --mode -m Operating mode to start in --nonint -n Non-interactive, output tab-separated fields --password -p Password to use for connection --port -P Port number to use for connection --skipcentral -s Skip reading the central configuration file --socket -S MySQL socket to use for connection --spark Length of status sparkline (default 10) --timestamp -t Print timestamp in -n mode (1: per iter; 2: per line) --user -u User for login if not current user --version Output version information and exit --write -w Write running configuration into home directory if no config files were loaded
其中,
-d:多久时间更新一次
-h:连接的主机名
-p:连接的端口
-S:socket的位置
-u:连接的用户
熟悉MysQL的童鞋不难理解。
登录进来后,默认是Dashboard。Innotop支持多种模式,Dashboard只是其中一种模式。通过“?”键我们可以查看所有模式

通过上述字母可切换到不同的状态下。
如何查看innotop的文档
1. # man innotop
2. # perldoc innotop
如何监控多个MySQL服务器
有两种方式:
一、直接在innotop交互式界面中添加,步骤如下:
# innotop
进入到交互式界面后,点击@键,会进入到连接配置界面

下面开始填写,主要有以下几项:

说明如下:
Choose connections for this mode:选择连接,如果连接不存在,则手动创建。所以下面会有提示“There is no connection called 'master26',create it?:”。
填写y,然后回车,会提示填写DSN string,按格式来即可。
其中在Enter password这一项需要注意,你输入密码的时候光标没有动,但实际上它是有输入,输入完毕,直接回车即可。
对于该种方法,简单,在监控机器较少的情况下,比较适用,但该方法的弊端在于一旦退出innotop,所有的配置信息都会丢失,重新进入,需重新配置。
所以,推荐的方法如下。
二、利用配置文件
# innotop --write,进入交互式界面后退出。会在当前目录下生成一个.innotop/innotop.conf
# ls .innotop/innotop.conf plugins# vim .innotop/innotop.conf
该配置文件中有关连接的配置信息,默认有一个localhost。
[connections]localhost=user= have_user= have_pass= dsn=DBI:mysql:;host=localhost;mysql_read_default_group=client savepass= dl_table=test.innotop_dl[/connections]当然,这个对我们编辑自己的配置信息没有多大用处,可以删除掉。
在此,可根据第一种方式添加一个connection信息,然后根据该信息进行相应的编辑。
以第一种方式中的master26为例,添加后,innotop.conf中的信息如下:
[connections]localhost=user= have_user= have_pass= dsn=DBI:mysql:;host=localhost;mysql_read_default_group=client savepass= dl_table=test.innotop_dlmaster26=user=root have_user=1 pass=123 have_pass=1 dsn=DBI:mysql:;host=192.168.91.26;port=3306 savepass=1[/connections]根据实际生产的需求,编辑innotop.conf文件。
[connections]master26=user=root have_user=1 pass=123 have_pass=1 dsn=DBI:mysql:;host=192.168.91.26;port=3306 savepass=1slave25=user=root have_user=1 pass=123 have_pass=1 dsn=DBI:mysql:;host=192.168.91.25;port=3306 savepass=1slave22=user=root have_user=1 pass=123 have_pass=1 dsn=DBI:mysql:;host=192.168.91.22;port=3306 savepass=1[/connections]启动innotop,默认监控的是master26的信息。

可通过“n”或“@”选择相应的服务器。
好虽好,但不够直观,我们希望本例中三个服务器的信息能显示在一个屏幕里,这样就不需要进行来回的切换,更直观。这里,就需要用到SERVER GROUPS的功能。
SERVER GROUPS
顾名思义,就是讲服务器进行分组,这种信息展示的粒度就不在是服务器,而是整个组了。
同样有两种方式添加:
一、直接在innotop交互式界面中添加
使用“#”键,首先创建组的名字,然后添加服务器,如下所示:

二、编辑配置文件
[server_groups]master-slave=master26 slave22 slave25[/server_groups]下面,我们来看看集群显示的效果
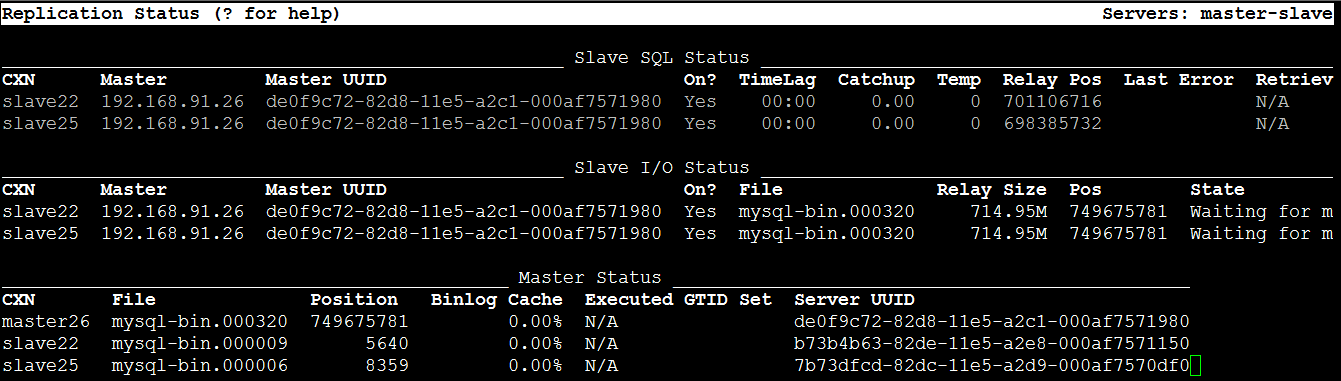
对于监控主从集群的状况,完全够用。
注意: 在innotop交互式界面中配置完毕后,需退出innotop,再进入,不然就不会显示CXN列。
总结:
1. 可能有人有疑虑,将密码保存到配置文件中,是否不安全,尤其是在生产环境下。其实,密码也可以不保存在配置文件中,配置如下:
[connections]server144=user=root have_user=1 have_pass=1 dsn=DBI:mysql:;host=192.168.244.144;port=3306 savepass= dl_table=[/connections]如果是在innotop交互式界面中添加,则最后一步Save password in plain text in the config file?: 写“n”即可。
2. 除了上述功能,innotop还是蛮强大的。譬如在M模式,即Replication Status下,可通过“o”键给服务器发送命令。如下所示:
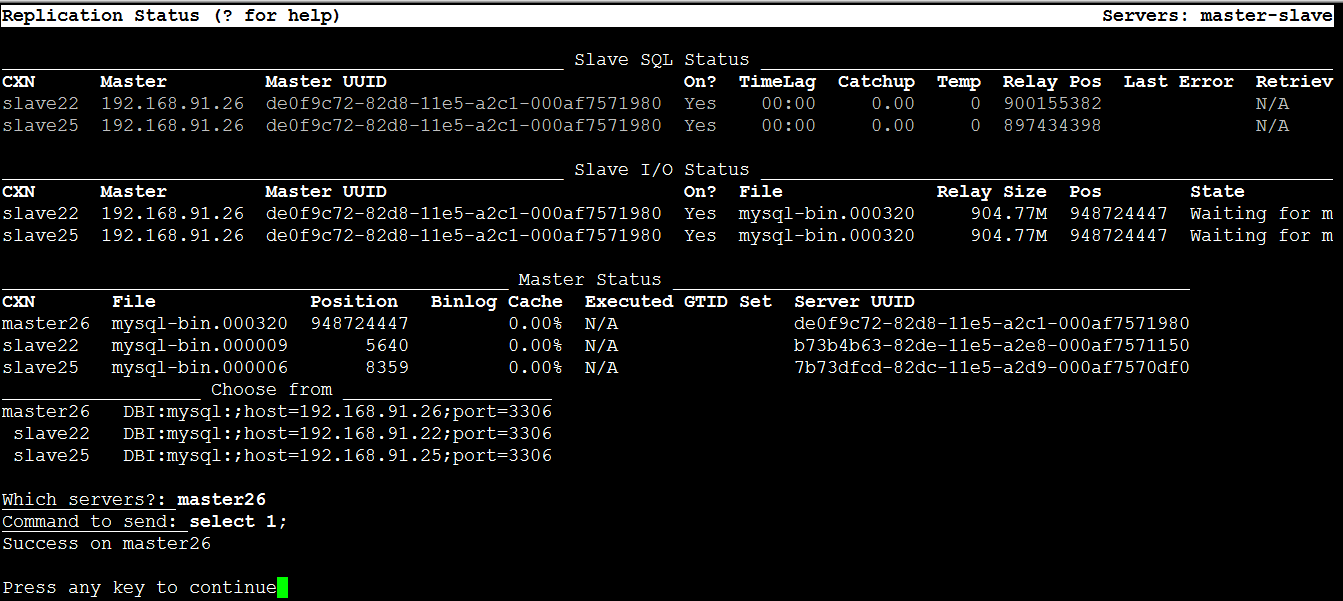
Anyway,Innotop功能还是及其强大的,大家慢慢琢磨吧~
参考:
https://www.percona.com/blog/2013/10/14/innotop-real-time-advanced-investigation-tool-mysql/
http://blog.chinaunix.net/uid-26446098-id-3410139.html
http://wenku.baidu.com/view/b71ed968af1ffc4ffe47ac2f.html innotop详解
InnoTop
是一个系统活动报告,类似于Linux性能工具,它与Linux的top命令相仿,并参考mytop工具而设计.
它专门用后监控InnoDB性能和MySQL服务器.主要用于监控事务,死锁,外键,查询活动,复制活动,系统变量的主要统计信息
及主机的其他详情。InnoTop被广泛使用,并被当做常用性能监控工具。
由于InnoTop使用Perl语言写成,所以需要安装perl环境和相关的工具包。
必须安装Time::HiRes,Term::ReadKey,DBI,DBD::mysql这四个包
[root@forummysql01 data]# perl -MCPAN -eshell
CPAN> install Time::HiRes
cd
CPAN> install Term::ReadKey
CPAN> install DBI
CPAN> install DBD::mysql
一.下载安装innotop-1.8
[root@forummysql01 data]# wget http://innotop.googlecode.com/files/innotop-1.8.0.tar.gz
[root@forummysql01 data]# tar xvzf innotop-1.8.0.tar.gz
[root@forummysql01 data]# cd innotop-1.8.0
[root@forummysql01 data]# perl Makefile.PL
[root@forummysql01 data]# make
[root@forummysql01 data]# make install
二.使用
/usr/local/mysql/bin/mysql -usystem -p'HD_root2010!' -S /data/mysqldata/3306/mysql.sock
innotop -u -p -h -P -S
示例: innotop -usystem -p'HD_root2010!' -P 3306 -S /data/mysqldata/3306/mysql.sock
以下是进入的页面状态
When Load QPS Slow Se/In/Up/De% QCacheHit KCacheHit BpsIn BpsOut
Now 0.05 0.19 0 0/ 0/550/50 0.00% 92.31% 32.67k 1.18k
Total 0.00 0.36 1.24k 20/3838/1473/3297 0.00% 93.88% 36.83k 284.40k
Cmd ID State User Host DB Time Query
其中 Load 是负载
QPS (Query Per Second) 表示每秒的查询率
Slow 代表慢查询的个数
Se/In/Up/De%: 增,删,改,查的比率
QCacheHit:查询缓冲的命中率
KCacheHit:索引的命中率
BpsIn (bytes Per Second in) 每秒钟输入的字节数
BpsOut(bytes Per Second Out)每秒钟输出的字节数
输入?可以进入帮助界面:如下:
Switch to a different mode:
B InnoDB Buffers L Locks R InnoDB Row Ops
C Command Summary M Replication Status S Variables & Status
D InnoDB Deadlocks O Open Tables T InnoDB Txns
F InnoDB FK Err Q Query List U User Statistics
I InnoDB I/O Info
Actions:
a Toggle the innotop process k Kill a query's connection
c Choose visible columns n Switch to the next connection
d Change refresh interval p Pause innotop
e Explain a thread's query q Quit innotop
f Show a thread's full query r Reverse sort order
h Toggle the header on and off s Change the display's sort column
i Toggle idle processes x Kill a query
Other:
TAB Switch to the next server group / Quickly filter what you see
! Show license and warranty = Toggle aggregation
# Select/create server groups @ Select/create server connections
$ Edit configuration settings \ Clear quick-filters
Press any key to continue
各种模式的切换都是:shift+字母
B模式:InnoDB Buffers
____________________________ Buffer Pool ____________________________
Size Free Bufs Pages Dirty Pages Hit Rate Memory Add'l Pool
512.00k 17863 495843 0 -- 8.19G 0
_____________________ Page Statistics ______________________
Reads Writes Created Reads/Sec Writes/Sec Creates/Sec
443950 5953289 51893 0.00 0.00 0.00
______________________ Insert Buffers ______________________
Inserts Merged Recs Merges Size Free List Len Seg. Size
_________________ Adaptive Hash Index __________________
Size Cells Used Node Heap Bufs Hash/Sec Non-Hash/Sec
0.00 0.00
其中:
Buffer Pool:
Size: 某sql使用的Buffer pool的大小
Free Bufs : Innodb_buffer_pool_pages_free的值,空页数。
Pages: Innodb_buffer_pool_pages_data的值,包含数据的页数(脏或干净).
Dirty Pages: Innodb_buffer_pool_pages_dirty的值,当前的脏页数
Hit Rate: 命中率
Memory : Innodb_buffer_pool_size的值
Add'l Pool: Innodb_additional_mem_pool_size的值
Page Statisics(页面统计)
Reads: Innodb_pages_read的值,读取的页数
Writes:Innodb_pages_written的值,写入的页数
Created:Innodb_pages_created的值,创建的页数
C模式:Command Summary (show Global status)
显示的值按降序排序,变量必须是数字,先按S再输入相关的参数的前缀名:
按s建:输入innodb 则:
D模式:InnoDB Deadlocks(产生的死锁,和产生死锁的语句)
____________________________________________________________________________________ Deadlock Transactions ____________________________________________________________________________________
ID Timestring User Host Victim Time Undo LStrcts Query Text
182513696 2012-11-15 15:39:30 apps_oper 192 No 00:00 215 9 insert into category_doc_info (category_id,doc_title,category_show,category_Coordinate) values(23692,'1941',1,2)
182519005 2012-11-15 15:39:30 apps_oper 192 Yes 00:00 0 4 delete from category_doc_info where (category_id = 23692)
______________________________________ Deadlock Locks ______________________________________
ID Waiting Mode DB Table Index Special Ins Intent
182513696 0 X apps category_doc_info INDEX_SEARCH rec but not gap 0
182513696 1 S apps category_doc_info INDEX_SEARCH 0
182519005 1 X apps category_doc_info INDEX_SEARCH rec but not gap 0
其中
ID:连接线程ID号
Timestring: 死锁发生的时间
User:用户名
Host:主机
M模式:Replication Status(查看复制状态的信息)
I模式: InnoDB I/O Info (查看InnoDB对应的I/O的信息)
O模式: 查看打开的表
Q模式(非常管用的一项):
然后e输入thread ID显示执行计划或者按F显示完整的sql语句。
- MySQL监控利器-Innotop
- MySQL监控利器-Innotop
- mysql监控管理工具--innotop
- innotop监控mysql
- innotop监控mysql
- mysql监控工具innotop
- MySQL性能利器:innotop工具
- MySQL监控工具之innotop
- MySQL监控工具之innotop
- Mysql监控工具Innotop工具安装
- Use Innotop Monitoring MySQL
- 使用innotop监测mysql
- Debian¢erOS下MySQL监控工具innotop 1.10安装及使用
- MySQL的实时性能监控利器
- innotop性能监视mysql,innodb工具
- Mysql性能和Linux性能监控利器----orzdba
- mysql性能监控软件 慢日志分析利器
- Mysql性能和Linux性能监控利器----orzdba
- 异常Error:Connection timed out: connect. If you are behind an HTTP proxy, please configure the proxy
- AutoCompeleteTestView--动态自动匹配输入的内容
- 由中间向两边渐变的分割线
- 应用间的数据接收和发送
- Andriod通过经纬度解析实际地址
- MySQL监控利器-Innotop
- Git中三种文件状态及其转换
- 上传工具类
- Scala学习笔记系列<1>
- Instant Run使用要注意的坑
- 39. Combination Sum
- 使用IntelliJ IDEA开发SpringMVC网站(四)用户管理
- oracle 创建 dblink
- 最短路问题 Dijkstra标号法