Avoiding Full GCs in HBase with MemStore-Local Allocation Buffers: Part 2
来源:互联网 发布:英伦 知乎 编辑:程序博客网 时间:2024/04/16 19:29
This is the second post in a series detailing a recent improvement in Apache HBase that helps to reduce the frequency of garbage collection pauses. Be sure you’ve read part 1 before continuing on to this post.
Recap from Part 1
In last week’s post, we noted that HBase has had problems coping with long garbage collection pauses, and we summarized the different garbage collection algorithms commonly used for HBase on the Sun/Oracle Java 6 JVM. Then, we hypothesized that the long garbage collection pauses are due to memory fragmentation, and devised an experiment to both confirm this hypothesis and investigate which workloads are most prone to this problem.
Experimental Results
Overview
As described in the previous post, I ran three different workload types against an HBase region server while collecting verbose GC logs with -XX:PrintFLSStatistics=1. I then wrote a short python script to parse the results and reformat into a TSV file, and graphed the resulting metrics using my favorite R graphing library, ggplot2:
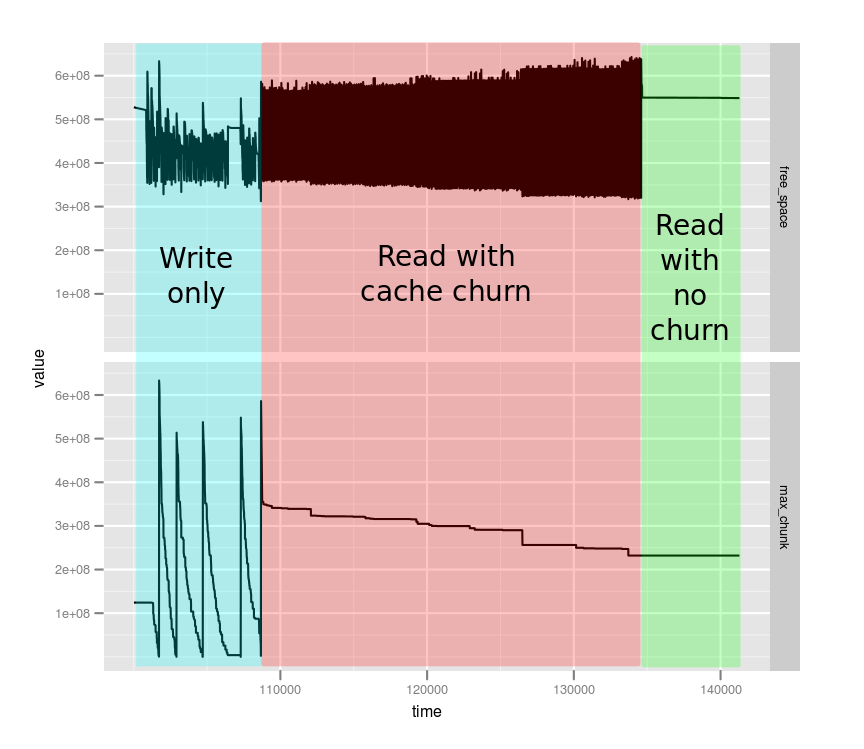
The top part of the graph shows free_space, the total amount of free space in the heap. The bottom graph shows max_chunk, the size of the largest chunk of contiguous free space. The X axis is time in seconds, and the Y axis has units of heap words. In this case a word is 8 bytes, since I am running a 64-bit JVM.
It was immediately obvious from this overview graph that the three different workloads have very different memory characteristics. We’ll zoom in on each in turn.
Write-only Workload
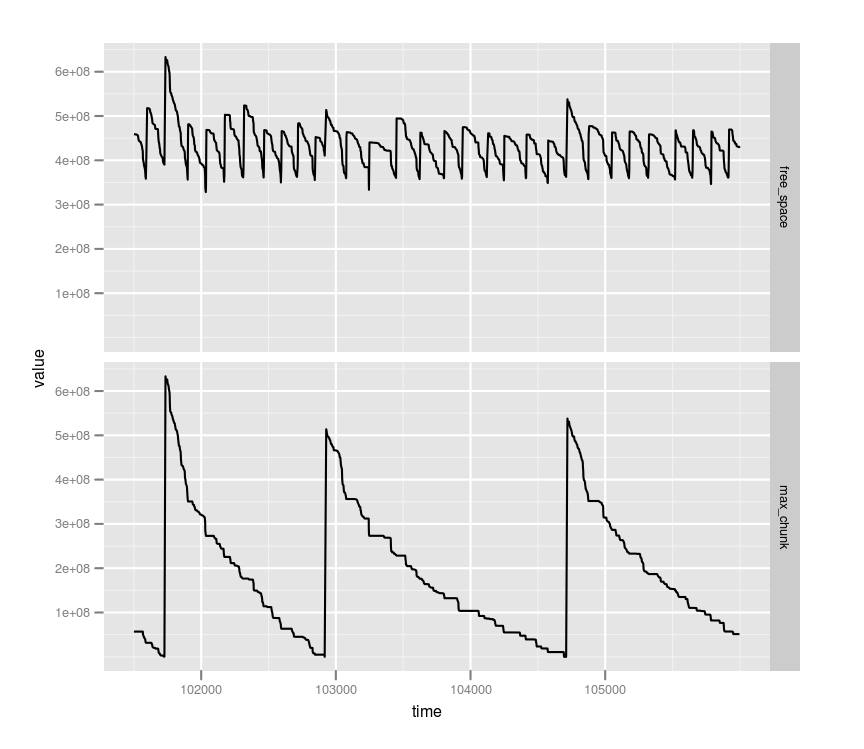
Zoomed in on the write-only workload, we can see two interesting patterns:
- The free_space graph shows a fluctuation between about 350 megawords (2.8GB) and 475 megawords (3.8GB). Each time the free space hits 2.8G, the CMS collector kicks in and frees up about 1GB of space. This shows that the CMS initiating occupancy fraction has been tuned to a low enough value – there is always a significant amount of free space in the heap. We can also see that there are no memory leaks – the heap usage keeps a fairly consistent profile over time and doesn’t trend in any direction.
- Although the CMS collector is kicking in to free up heap, the max_chunk graph is seen to drop precipitously nearly down to 0. Each time it reaches 0 (eg at around t=102800) we see a sharp spike back up to a large value.
By correlating this graph with the GC logs, I noted that the long full GCs corresponded exactly to the vertical spikes in the max_chunk graph — after each of these full GCs, the heap had been defragmented, so all of the free space was in one large chunk.
So, we’ve learned that the write load does indeed cause heap fragmentation and that the long pauses occur when there are no large free chunks left in the heap.
Read-only Workload with Cache Churn

In the second workload, the clients perform only reads, and the set of records to be read is much larger than the size of the LRU block cache. So, we see a large amount of memory churn as items are pulled into and evicted from the cache.
The free_space graph reflects this – it shows much more frequent collections than the write-only workload. However, we note that the max_chunk graph stays pretty constant around its starting value. This suggests that the read-only workload doesn’t cause heap fragmentation nearly as badly as the write workload, even though the memory churn is much higher.
Read-only Workload without Cache Churn
The third workload, colored green in the overview graph, turned out to be quite boring. Because there’s no cache churn, the only allocations being done were short-lived objects for servicing each RPC request. Hence, they were never promoted to the old generation, and both free_space and max_chunk time series stayed entirely constant.
Experiment Summary
To summarize the results of this experiment:
- The full GCs we’d like to eliminate are due to fragmentation, not concurrent-mode failure.
- The write-only workload causes fragmentation much more than either read workload.
Why HBase Writes Fragment the Heap
Now that we know that write workloads cause rapid heap fragmentation, let’s take a step back and think about why. In order to do so, we’ll take a brief digression to give an overview of how HBase’s write path works.
The HBase Write Path
In order to store a very large dataset distributed across many machines, Apache HBase partitions each table into segments called Regions. Each region has a designated “start key” and “stop key”, and contains every row where the key falls between the two. This scheme can be compared to primary key-based range partitions in an RDBMS, though HBase manages the partitions automatically and transparently. Each region is typically less than a gigabyte in size, so every server in an HBase cluster is responsible for several hundred regions. Read and write requests are routed to the server currently hosting the target region.
Once a write request has reached the correct server, the new data is added to an in-memory structure called a MemStore. This is essentially a sorted map, per region, containing all recently written data. Of course, memory is a finite resource, and thus the region server carefully accounts memory usage and triggers a flush on a MemStore when the usage has crossed some threshold. The flush writes the data to disk and frees up the memory.
MemStore Fragmentation
Let’s imagine that a region server is hosting 5 regions — colored pink, blue, green, red, and yellow in the diagram below. It is being subjected to a random write workload where the writes are spread evenly across the regions and arrive in no particular order.
As the writes come in, new buffers are allocated for each row, and these buffers are promoted into the old generation, since they stay in the MemStore for several minutes waiting to be flushed. Since the writes arrive in no particular order, data from different regions is intermingled in the old generation. When one of the regions is flushed, however, this means we can’t free up any large contiguous chunk, and we’re guaranteed to get fragmentation:
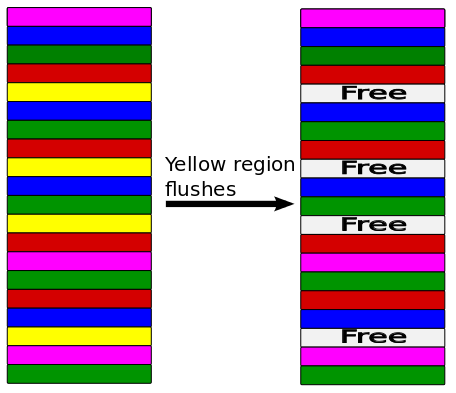
This behavior results in exactly what our experiment showed: over time, writes will always cause severe fragmentation in the old generation, leading to a full garbage collection pause.
To be continued…
In this post we reviewed the results of our experiment, and came to understand why writes in HBase cause memory fragmentation. In the next and last post in this series, we’ll look at the design of MemStore-Local Allocation Buffers, which avoid fragmentation and thus avoid full GCs.
Ref: http://www.cloudera.com/blog/2011/02/avoiding-full-gcs-in-hbase-with-memstore-local-allocation-buffers-part-2/
- Avoiding Full GCs in HBase with MemStore-Local Allocation Buffers: Part 2
- Avoiding Full GCs in HBase with MemStore-Local Allocation Buffers: Part 1
- Avoiding Full GCs in HBase with MemStore-Local Allocation Buffers: Part 3
- Memstore-Local Allocation Buffer
- TLAB ( Thread Local Allocation Buffers )
- Protocol Buffers in HBase
- Hbase MemStore
- HBase Memstore
- Rolling with Rails 2.0 - The First Full Tutorial - Part 2
- 利用Arena Allocation避免HBase触发Full GC
- 利用Arena Allocation避免HBase触发Full GC
- 利用Arena Allocation避免HBase触发Full GC
- HBase Memstore Flush
- 深入理解HBase Memstore
- 深入理解HBase Memstore
- 深入理解HBase Memstore
- 深入理解HBase Memstore
- 深入理解HBase Memstore
- SVG xlink
- 视频学习网站
- Getter / Setter 的滥用
- windows扫雷注入(1s完成扫雷)
- android实现程序的后台运行
- Avoiding Full GCs in HBase with MemStore-Local Allocation Buffers: Part 2
- Android UI设计准则
- 《java 多线程中的死锁》
- page_clientValidate也分组
- Java中Could not find the main class.program will exit和java.lang.UnsupportedClassVersionError 的解决方法
- [ios开发ios5新特性之]如何在iOS5中定制用户界面
- Avoiding Full GCs in HBase with MemStore-Local Allocation Buffers: Part 3
- shell遍历文件下所有文件
- 函数——>oracle详细