使用ganglia监控hadoop及hbase集群
来源:互联网 发布:现货分析软件下载 编辑:程序博客网 时间:2024/04/20 06:13
介绍性内容来自:http://www.uml.org.cn/sjjm/201305171.asp
一、Ganglia简介
Ganglia 是 UC Berkeley 发起的一个开源监视项目,设计用于测量数以千计的节点。每台计算机都运行一个收集和发送度量数据(如处理器速度、内存使用量等)的名为 gmond 的守护进程。它将从操作系统和指定主机中收集。接收所有度量数据的主机可以显示这些数据并且可以将这些数据的精简表单传递到层次结构中。正因为有这种层次结构模式,才使得 Ganglia 可以实现良好的扩展。gmond 带来的系统负载非常少,这使得它成为在集群中各台计算机上运行的一段代码,而不会影响用户性能
1.1 Ganglia组件
Ganglia 监控套件包括三个主要部分:gmond,gmetad,和网页接口,通常被称为ganglia-web。
Gmond :是一个守护进程,他运行在每一个需要监测的节点上,收集监测统计,发送和接受在同一个组播或单播通道上的统计信息 如果他是一个发送者(mute=no)他会收集基本指标,比如系统负载(load_one),CPU利用率。他同时也会发送用户通过添加C/Python模块来自定义的指标。 如果他是一个接收者(deaf=no)他会聚合所有从别的主机上发来的指标,并把它们都保存在内存缓冲区中。
Gmetad:也是一个守护进程,他定期检查gmonds,从那里拉取数据,并将他们的指标存储在RRD存储引擎中。他可以查询多个集群并聚合指标。他也被用于生成用户界面的web前端。
Ganglia-web :顾名思义,他应该安装在有gmetad运行的机器上,以便读取RRD文件。 集群是主机和度量数据的逻辑分组,比如数据库服务器,网页服务器,生产,测试,QA等,他们都是完全分开的,你需要为每个集群运行单独的gmond实例。
一般来说每个集群需要一个接收的gmond,每个网站需要一个gmetad。
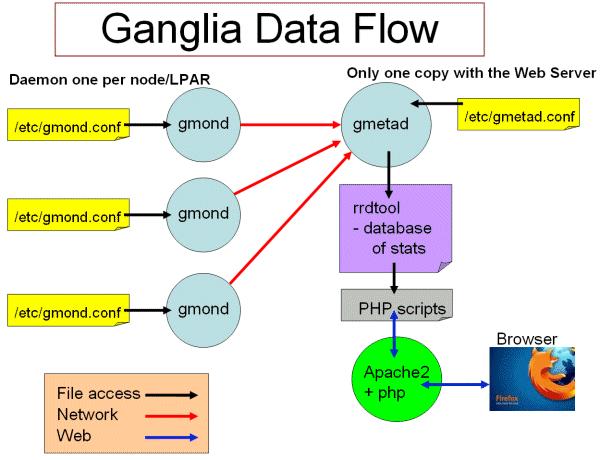
图1 ganglia工作流
Ganglia工作流如图1所示:
左边是运行在各个节点上的gmond进程,这个进程的配置只由节点上/etc/gmond.conf的文件决定。所以,在各个监视节点上都需要安装和配置该文件。
右上角是更加负责的中心机(通常是这个集群中的一台,也可以不是)。在这个台机器上运行这着gmetad进程,收集来自各个节点上的信息并存储在RRDtool上,该进程的配置只由/etc/gmetad.conf决定。
右下角显示了关于网页方面的一些信息。我们的浏览网站时调用php脚本,从RRDTool数据库中抓取信息,动态的生成各类图表。
1.2 Ganglia运行模式(单播与多播)
Ganglia的收集数据工作可以工作在单播(unicast)或多播(multicast)模式下,默认为多播模式。
单播:发送自己收集到的监控数据到特定的一台或几台机器上,可以跨网段。
多播:发送自己收集到的监控数据到同一网段内所有的机器上,同时收集同一网段内的所有机器发送过来的监控数据。因为是以广播包的形式发送,因此需要同一网段内。但同一网段内,又可以定义不同的发送通道。
二、安装ganglia
1、拓扑说明
3台主机,分别为:
10.171.29.191 master10.171.94.155 slave110.251.0.197 slave3
其中master将gmeta及web,三台机都作gmon
以下步骤均使用root用户执行
2、master上安装gmeta及web
yum install ganglia-web.x86_64yum install ganglia-gmetad.x86_64
3、在三台机上都安抚gmond
yum install ganglia-gmond.x86_64
4、在三台机器上配置/etc/ganglia/gmond.conf,修改以下内容:
udp_send_channel { #bind_hostname = yes # Highly recommended, soon to be default. # This option tells gmond to use a source address # that resolves to the machine's hostname. Without # this, the metrics may appear to come from any # interface and the DNS names associated with # those IPs will be used to create the RRDs. mcast_join = 10.171.29.191 port = 8649 ttl = 1}/* You can specify as many udp_recv_channels as you like as well. */udp_recv_channel { #mcast_join = 239.2.11.71 port = 8649 #bind = 239.2.11.71}即将默认的多播地址改为master地址,将udp_recv_channel 的2个IP注释掉。
5、在master上修改/etc/ganglia/gmetad.conf
修改data_source,改成:
data_source "my cluster” 10.171.29.191
6、ln -s /usr/share/ganglia /var/www/ganglia
若有问题,可以将/usr/share/ganglia的内容直接复制到/var/www/ganglia
7、修改/etc/httpd/conf.d/ganglia.conf,改成:
# # Ganglia monitoring system php web frontend # Alias /ganglia /usr/share/ganglia <Location /ganglia> Order deny,allow Allow from all Allow from 127.0.0.1 Allow from ::1 # Allow from .example.com </Location>即将 Deny from all 改为 Allow from all,否则在页面访问时有权限问题。
8、启动
service gmetad startservice gmond start/usr/sbin/apachectl start
9、从页面上访问
http://ip/ganglia
一些注意问题:
1、gmetad收集到的信息被放到/var/lib/ganglia/rrds/
2、可以通过以下命令检查是否有数据在传输
tcpdump port 8649
三、配置hadoop与hbase
1、配置hadoop
hadoop-metrics2.properties
# syntax: [prefix].[source|sink|jmx].[instance].[options]# See package.html for org.apache.hadoop.metrics2 for details*.sink.file.class=org.apache.hadoop.metrics2.sink.FileSink#namenode.sink.file.filename=namenode-metrics.out#datanode.sink.file.filename=datanode-metrics.out#jobtracker.sink.file.filename=jobtracker-metrics.out#tasktracker.sink.file.filename=tasktracker-metrics.out#maptask.sink.file.filename=maptask-metrics.out#reducetask.sink.file.filename=reducetask-metrics.out# Below are for sending metrics to Ganglia## for Ganglia 3.0 support# *.sink.ganglia.class=org.apache.hadoop.metrics2.sink.ganglia.GangliaSink30## for Ganglia 3.1 support*.sink.ganglia.class=org.apache.hadoop.metrics2.sink.ganglia.GangliaSink31*.sink.ganglia.period=10# default for supportsparse is false*.sink.ganglia.supportsparse=true*.sink.ganglia.slope=jvm.metrics.gcCount=zero,jvm.metrics.memHeapUsedM=both*.sink.ganglia.dmax=jvm.metrics.threadsBlocked=70,jvm.metrics.memHeapUsedM=40menode.sink.ganglia.servers=10.171.29.191:8649datanode.sink.ganglia.servers=10.171.29.191:8649jobtracker.sink.ganglia.servers=10.171.29.191:8649tasktracker.sink.ganglia.servers=10.171.29.191:8649maptask.sink.ganglia.servers=10.171.29.191:8649reducetask.sink.ganglia.servers=10.171.29.191:8649
2、配置hbase
hadoop-metrics.properties
# See http://wiki.apache.org/hadoop/GangliaMetrics# Make sure you know whether you are using ganglia 3.0 or 3.1.# If 3.1, you will have to patch your hadoop instance with HADOOP-4675# And, yes, this file is named hadoop-metrics.properties rather than# hbase-metrics.properties because we're leveraging the hadoop metrics# package and hadoop-metrics.properties is an hardcoded-name, at least# for the moment.## See also http://hadoop.apache.org/hbase/docs/current/metrics.html# GMETADHOST_IP is the hostname (or) IP address of the server on which the ganglia # meta daemon (gmetad) service is running# Configuration of the "hbase" context for NullContextWithUpdateThread# NullContextWithUpdateThread is a null context which has a thread calling# periodically when monitoring is started. This keeps the data sampled# correctly.hbase.class=org.apache.hadoop.metrics.spi.NullContextWithUpdateThreadhbase.period=10# Configuration of the "hbase" context for file# hbase.class=org.apache.hadoop.hbase.metrics.file.TimeStampingFileContext# hbase.fileName=/tmp/metrics_hbase.log# HBase-specific configuration to reset long-running stats (e.g. compactions)# If this variable is left out, then the default is no expiration.hbase.extendedperiod = 3600# Configuration of the "hbase" context for ganglia# Pick one: Ganglia 3.0 (former) or Ganglia 3.1 (latter)# hbase.class=org.apache.hadoop.metrics.ganglia.GangliaContexthbase.class=org.apache.hadoop.metrics.ganglia.GangliaContext31hbase.period=10hbase.servers=10.171.29.191:8649# Configuration of the "jvm" context for nulljvm.class=org.apache.hadoop.metrics.spi.NullContextWithUpdateThreadjvm.period=10# Configuration of the "jvm" context for file# jvm.class=org.apache.hadoop.hbase.metrics.file.TimeStampingFileContext# jvm.fileName=/tmp/metrics_jvm.log# Configuration of the "jvm" context for ganglia# Pick one: Ganglia 3.0 (former) or Ganglia 3.1 (latter)# jvm.class=org.apache.hadoop.metrics.ganglia.GangliaContextjvm.class=org.apache.hadoop.metrics.ganglia.GangliaContext31jvm.period=10jvm.servers=10.171.29.191:8649# Configuration of the "rpc" context for nullrpc.class=org.apache.hadoop.metrics.spi.NullContextWithUpdateThreadrpc.period=10# Configuration of the "rpc" context for file# rpc.class=org.apache.hadoop.hbase.metrics.file.TimeStampingFileContext# rpc.fileName=/tmp/metrics_rpc.log# Configuration of the "rpc" context for ganglia# Pick one: Ganglia 3.0 (former) or Ganglia 3.1 (latter)# rpc.class=org.apache.hadoop.metrics.ganglia.GangliaContextrpc.class=org.apache.hadoop.metrics.ganglia.GangliaContext31rpc.period=10rpc.servers=10.171.29.191:8649# Configuration of the "rest" context for ganglia# Pick one: Ganglia 3.0 (former) or Ganglia 3.1 (latter)# rest.class=org.apache.hadoop.metrics.ganglia.GangliaContextrest.class=org.apache.hadoop.metrics.ganglia.GangliaContext31rest.period=10rest.servers=10.171.29.191:8649
重启hadoop与hbase。
- 使用ganglia监控hadoop及hbase集群
- 使用ganglia监控hadoop及hbase集群
- 使用ganglia监控hadoop及hbase集群
- Ganglia监控hadoop、hbase集群
- Ganglia监控Hadoop及Hbase集群性能(安装配置)
- wang-----Ganglia监控Hadoop及Hbase集群性能(安装配置)
- Ganglia监控Hadoop及Hbase集群性能(安装配置)
- Ganglia监控Hadoop及Hbase集群性能(安装配置)
- 使用Ganglia监控Hadoop,hbase
- 使用ganglia监控hadoop,hbase
- Ganglia监控Hadoop与HBase集群
- HBase总结(十七)Ganglia监控hadoop、hbase集群
- ganglia监控hadoop集群
- ubuntu安装Ganglia监控Hadoop及Hbase集群性能(安装配置)
- CentOS下安装与配置Ganglia监控Hadoop集群及HBase
- Ubuntu1604安装ganglia并监控Hadoop/HBase/Spark集群
- 用 Ganglia 监控hadoop集群
- 用 Ganglia 监控hadoop集群
- hadoop容灾能力测试
- 如果看了这篇文章你还不懂傅里叶变换,那就过来掐死我吧
- hprof教程
- crontab经验
- irms模拟数据生成及数据分析
- 使用ganglia监控hadoop及hbase集群
- Mahout快速入门教程
- 分类算法简介
- Hibernate 锁机制
- SAT数学解题方法总结
- 分布式服务框架 Zookeeper -- 管理分布式环境中的数据
- Injector Job深入分析
- hadoop调优之一:概述
- HBase -ROOT-和.META.表结构(region定位原理)