Ganglia监控hadoop、hbase集群
来源:互联网 发布:搬家软件app 编辑:程序博客网 时间:2024/04/18 14:05
1. 在主节点上安装ganglia-webfrontend和ganglia-monitor
复制代码在主节点上安装ganglia-webfrontend和ganglia-monitor。在其他监视节点上,只需要安装ganglia-monitor即可
将ganglia的文件链接到apache的默认目录下
复制代码
2. 安装ganglia-monitor
在其他监视节点上,只需要安装ganglia-monitor
复制代码
3. Ganglia配置
gmond.conf
在每个节点上都需要配置/etc/ganglia/gmond.conf,配置相同如下所示
复制代码
修改后的/etc/ganglia/gmond.conf
复制代码
gmetad.conf
在主节点上还需要配置/etc/ganglia/gmetad.conf,这里面的名字hadoop-cluster和上面gmond.conf中name应该一致。
/etc/ganglia/gmetad.conf
复制代码修改为以下内容
复制代码
4. Hadoop配置
在所有hadoop所在的节点,均需要配置hadoop-metrics2.properties,配置如下:
复制代码
5. Hbase配置
在所有的hbase节点中均配置hadoop-metrics2-hbase.properties,配置如下:
复制代码
6. 启动hadoop、hbase集群
复制代码
7. 启动Ganglia
先需要重启hadoop和hbase 。在各个节点上启动gmond服务,主节点还需要启动gmetad服务。
使用apt-get方式安装的Ganglia,可以直接用service方式启动。
复制代码
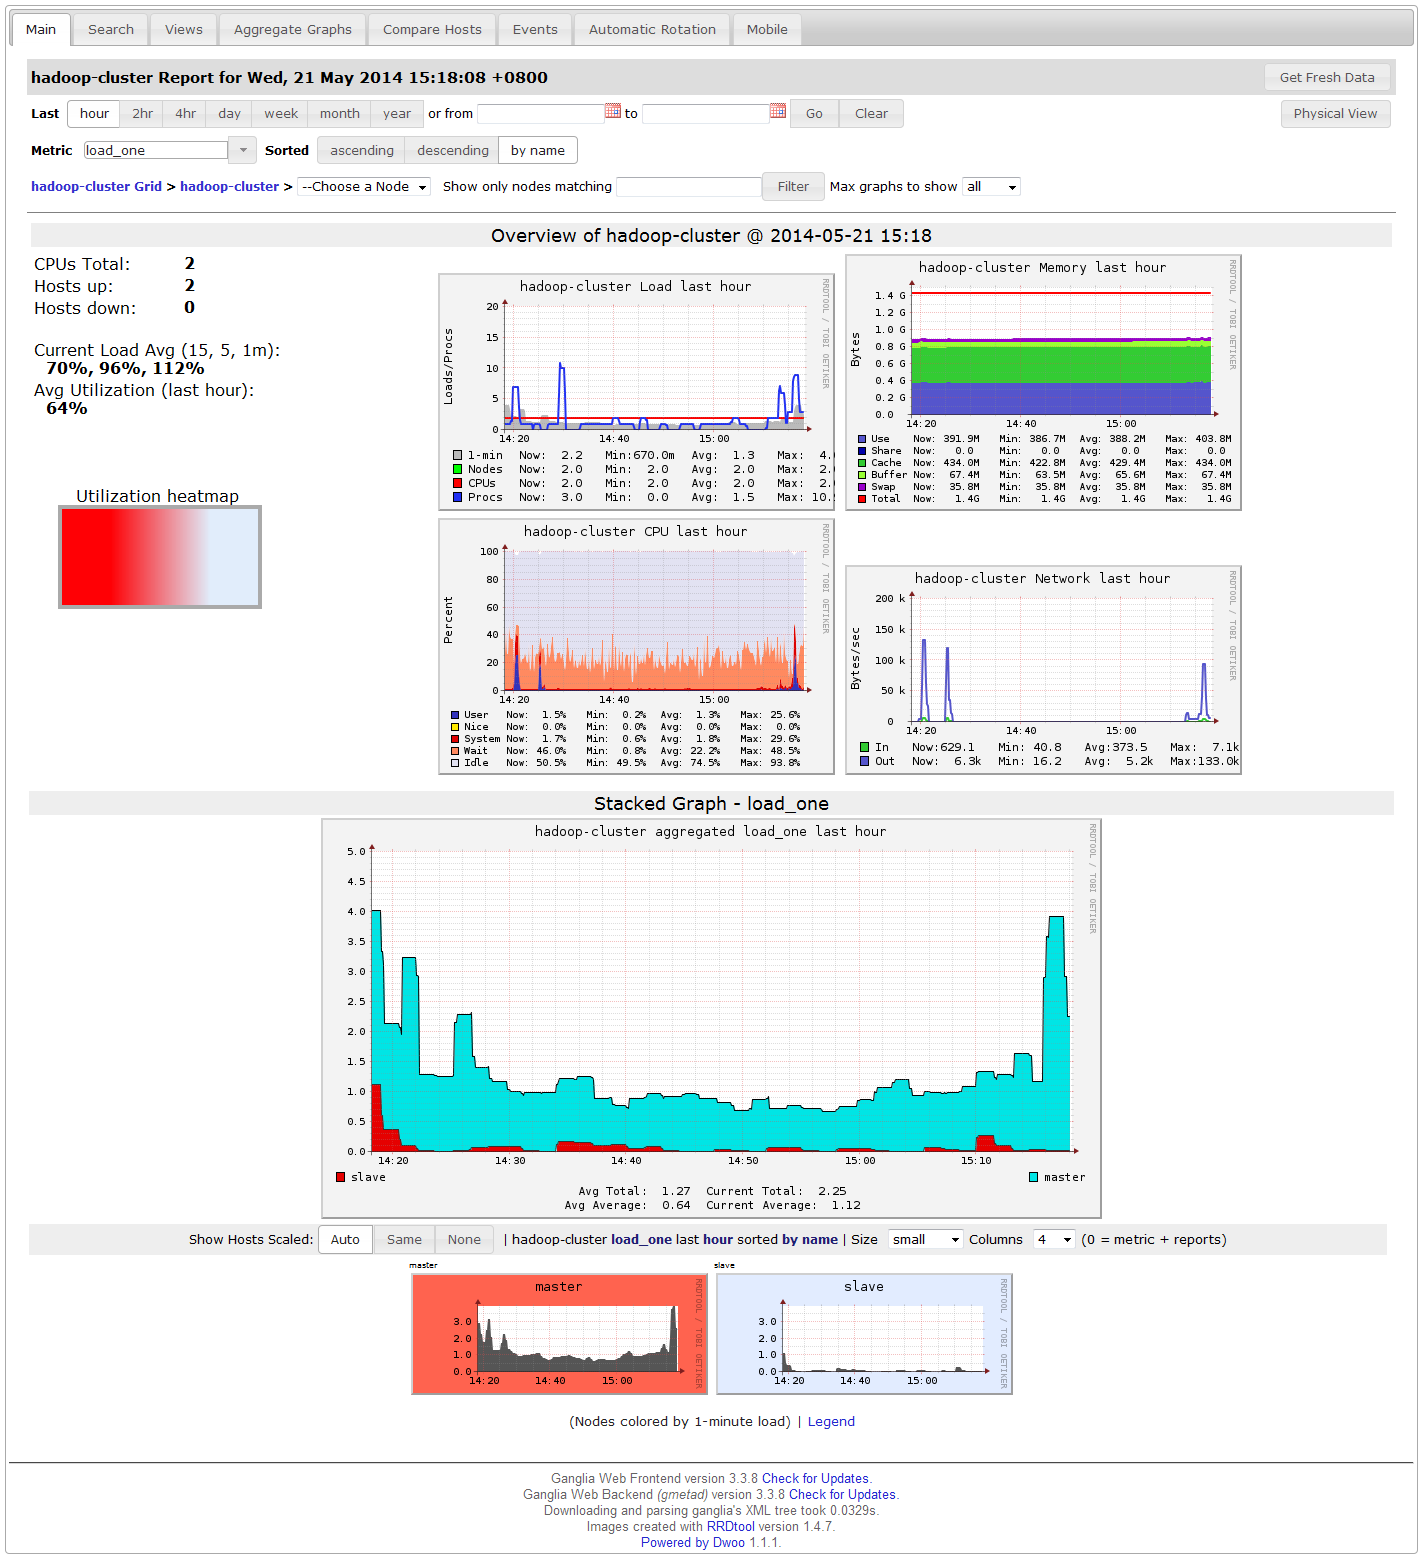
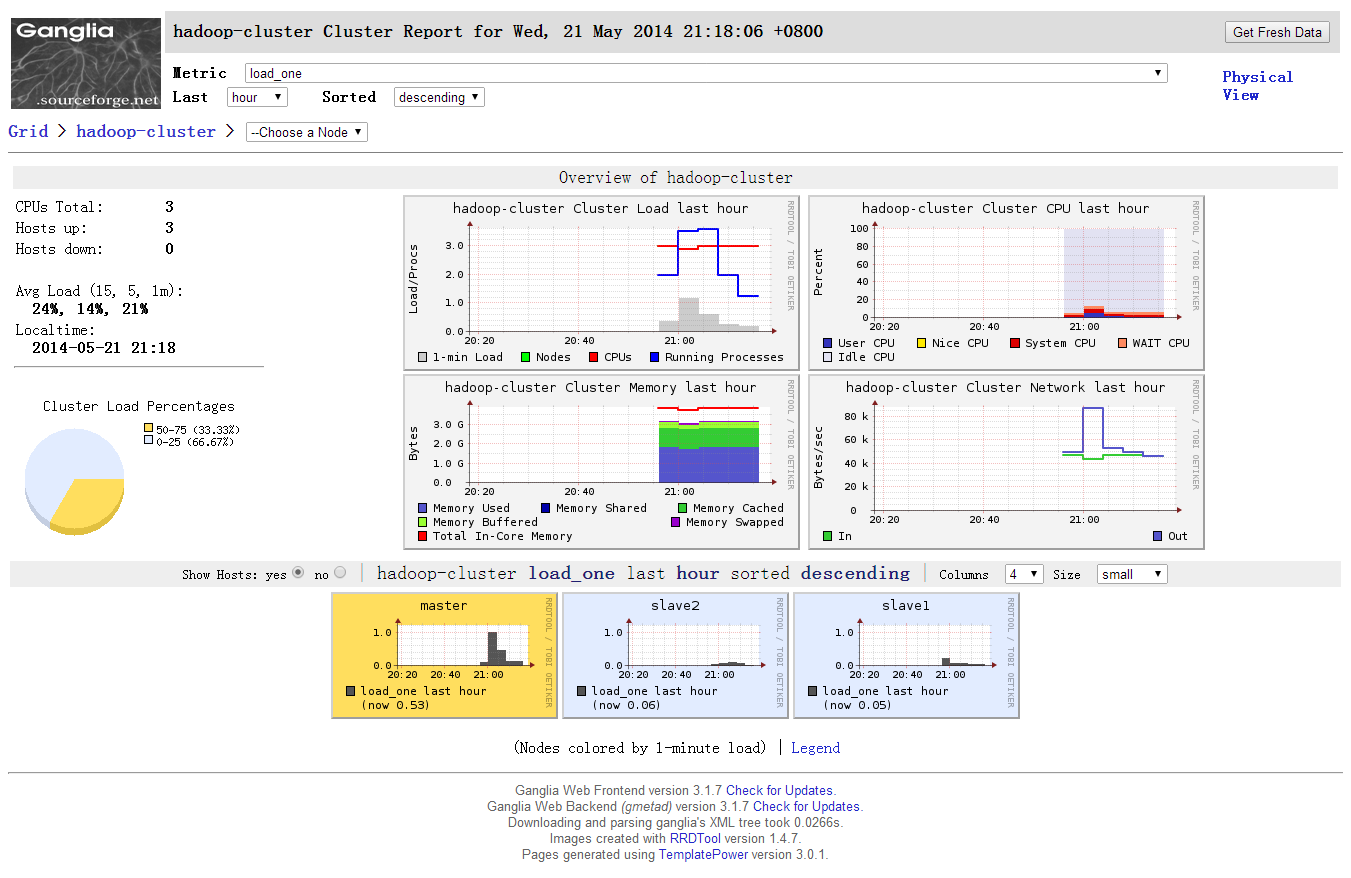
8. 检验
登录浏览器查看:http://master/ganglia,如果Hosts up为9即表示安装成功。
若安装不成功,有几个很有用的调试命令:
以调试模式启动gmetad:gmetad -d 9
查看gmetad收集到的XML文件:telnet master 8649
9. 截图
master节点gmetad.conf配置
复制代码
master节点gmond.conf配置
复制代码
- sudo apt-get install ganglia-webfrontend ganglia-monitor
将ganglia的文件链接到apache的默认目录下
- sudo ln -s /usr/share/ganglia-webfrontend /var/www/ganglia
2. 安装ganglia-monitor
在其他监视节点上,只需要安装ganglia-monitor
- sudo apt-get install ganglia-monitor
3. Ganglia配置
gmond.conf
在每个节点上都需要配置/etc/ganglia/gmond.conf,配置相同如下所示
- sudo vim /etc/ganglia/gmond.conf
修改后的/etc/ganglia/gmond.conf
- globals {
- daemonize = yes ##以后台的方式运行
- setuid = yes
- user = ganglia #运行Ganglia的用户
- debug_level = 0
- max_udp_msg_len = 1472
- mute = no
- deaf = no
- host_dmax = 0 /*secs */
- cleanup_threshold = 300 /*secs */
- gexec = no
- send_metadata_interval = 10 #发送数据的时间间隔
- }
- /* If a cluster attribute is specified, then all gmond hosts are wrapped inside
- * of a <CLUSTER> tag. If you do not specify a cluster tag, then all <HOSTS> will
- * NOT be wrapped inside of a <CLUSTER> tag. */
- cluster {
- name = "hadoop-cluster" #集群名称
- owner = "ganglia" #运行Ganglia的用户
- latlong = "unspecified"
- url = "unspecified"
- }
- /* The host section describes attributes of the host, like the location */
- host {
- location = "unspecified"
- }
- /* Feel free to specify as many udp_send_channels as you like. Gmond
- used to only support having a single channel */
- udp_send_channel {
- #mcast_join = 239.2.11.71 #注释掉组播
- host = master #发送给安装gmetad的机器
- port = 8649 #监听端口
- ttl = 1
- }
- /* You can specify as many udp_recv_channels as you like as well. */
- udp_recv_channel {
- #mcast_join = 239.2.11.71 #注释掉组播
- port = 8649
- #bind = 239.2.11.71
- }
- /* You can specify as many tcp_accept_channels as you like to share
- an xml description of the state of the cluster */
- tcp_accept_channel {
- port = 8649
- }
gmetad.conf
在主节点上还需要配置/etc/ganglia/gmetad.conf,这里面的名字hadoop-cluster和上面gmond.conf中name应该一致。
/etc/ganglia/gmetad.conf
- sudo vim /etc/ganglia/gmetad.conf
- data_source "hadoop-cluster" 10 master:8649 slave:8649
- setuid_username "nobody"
- rrd_rootdir "/var/lib/ganglia/rrds"
- gridname "hadoop-cluster"
- 注:master:8649 slave:8649为要监听的主机和端口,data_source中hadoop-cluster与gmond.conf中name一致
4. Hadoop配置
在所有hadoop所在的节点,均需要配置hadoop-metrics2.properties,配置如下:
- # Licensed to the Apache Software Foundation (ASF) under one or more
- # contributor license agreements. See the NOTICE file distributed with
- # this work for additional information regarding copyright ownership.
- # The ASF licenses this file to You under the Apache License, Version 2.0
- # (the "License"); you may not use this file except in compliance with
- # the License. You may obtain a copy of the License at
- #
- # http://www.apache.org/licenses/LICENSE-2.0
- #
- # Unless required by applicable law or agreed to in writing, software
- # distributed under the License is distributed on an "AS IS" BASIS,
- # WITHOUT WARRANTIES OR CONDITIONS OF ANY KIND, either express or implied.
- # See the License for the specific language governing permissions and
- # limitations under the License.
- #
- # syntax: [prefix].[source|sink].[instance].[options]
- # See javadoc of package-info.java for org.apache.hadoop.metrics2 for details
- #注释掉以前原有配置
- #*.sink.file.class=org.apache.hadoop.metrics2.sink.FileSink
- # default sampling period, in seconds
- #*.period=10
- # The namenode-metrics.out will contain metrics from all context
- #namenode.sink.file.filename=namenode-metrics.out
- # Specifying a special sampling period for namenode:
- #namenode.sink.*.period=8
- #datanode.sink.file.filename=datanode-metrics.out
- # the following example split metrics of different
- # context to different sinks (in this case files)
- #jobtracker.sink.file_jvm.context=jvm
- #jobtracker.sink.file_jvm.filename=jobtracker-jvm-metrics.out
- #jobtracker.sink.file_mapred.context=mapred
- #jobtracker.sink.file_mapred.filename=jobtracker-mapred-metrics.out
- #tasktracker.sink.file.filename=tasktracker-metrics.out
- #maptask.sink.file.filename=maptask-metrics.out
- #reducetask.sink.file.filename=reducetask-metrics.out
- *.sink.ganglia.class=org.apache.hadoop.metrics2.sink.ganglia.GangliaSink31
- *.sink.ganglia.period=10
- *.sink.ganglia.slope=jvm.metrics.gcCount=zero,jvm.metrics.memHeapUsedM=both
- *.sink.ganglia.dmax=jvm.metrics.threadsBlocked=70,jvm.metrics.memHeapUsedM=40
- namenode.sink.ganglia.servers=master:8649
- resourcemanager.sink.ganglia.servers=master:8649
- datanode.sink.ganglia.servers=master:8649
- nodemanager.sink.ganglia.servers=master:8649
- maptask.sink.ganglia.servers=master:8649
- reducetask.sink.ganglia.servers=master:8649
5. Hbase配置
在所有的hbase节点中均配置hadoop-metrics2-hbase.properties,配置如下:
- # syntax: [prefix].[source|sink].[instance].[options]
- # See javadoc of package-info.java for org.apache.hadoop.metrics2 for details
- #*.sink.file*.class=org.apache.hadoop.metrics2.sink.FileSink
- # default sampling period
- #*.period=10
- # Below are some examples of sinks that could be used
- # to monitor different hbase daemons.
- # hbase.sink.file-all.class=org.apache.hadoop.metrics2.sink.FileSink
- # hbase.sink.file-all.filename=all.metrics
- # hbase.sink.file0.class=org.apache.hadoop.metrics2.sink.FileSink
- # hbase.sink.file0.context=hmaster
- # hbase.sink.file0.filename=master.metrics
- # hbase.sink.file1.class=org.apache.hadoop.metrics2.sink.FileSink
- # hbase.sink.file1.context=thrift-one
- # hbase.sink.file1.filename=thrift-one.metrics
- # hbase.sink.file2.class=org.apache.hadoop.metrics2.sink.FileSink
- # hbase.sink.file2.context=thrift-two
- # hbase.sink.file2.filename=thrift-one.metrics
- # hbase.sink.file3.class=org.apache.hadoop.metrics2.sink.FileSink
- # hbase.sink.file3.context=rest
- # hbase.sink.file3.filename=rest.metrics
- *.sink.ganglia.class=org.apache.hadoop.metrics2.sink.ganglia.GangliaSink31
- *.sink.ganglia.period=10
- hbase.sink.ganglia.period=10
- hbase.sink.ganglia.servers=master:8649
6. 启动hadoop、hbase集群
- start-dfs.sh
- start-yarn.sh
- start-hbase.sh
7. 启动Ganglia
先需要重启hadoop和hbase 。在各个节点上启动gmond服务,主节点还需要启动gmetad服务。
使用apt-get方式安装的Ganglia,可以直接用service方式启动。
- sudo service ganglia-monitor start(每台机器都需要启动)
- sudo service gmetad start(在安装了ganglia-webfrontend的机器上启动)
8. 检验
登录浏览器查看:http://master/ganglia,如果Hosts up为9即表示安装成功。
若安装不成功,有几个很有用的调试命令:
以调试模式启动gmetad:gmetad -d 9
查看gmetad收集到的XML文件:telnet master 8649
9. 截图
master节点gmetad.conf配置
- # This is an example of a Ganglia Meta Daemon configuration file
- # http://ganglia.sourceforge.net/
- #
- #
- #-------------------------------------------------------------------------------
- # Setting the debug_level to 1 will keep daemon in the forground and
- # show only error messages. Setting this value higher than 1 will make
- # gmetad output debugging information and stay in the foreground.
- # default: 0
- # debug_level 10
- #
- #-------------------------------------------------------------------------------
- # What to monitor. The most important section of this file.
- #
- # The data_source tag specifies either a cluster or a grid to
- # monitor. If we detect the source is a cluster, we will maintain a complete
- # set of RRD databases for it, which can be used to create historical
- # graphs of the metrics. If the source is a grid (it comes from another gmetad),
- # we will only maintain summary RRDs for it.
- #
- # Format:
- # data_source "my cluster" [polling interval] address1:port addreses2:port ...
- #
- # The keyword 'data_source' must immediately be followed by a unique
- # string which identifies the source, then an optional polling interval in
- # seconds. The source will be polled at this interval on average.
- # If the polling interval is omitted, 15sec is asssumed.
- #
- # If you choose to set the polling interval to something other than the default,
- # note that the web frontend determines a host as down if its TN value is less
- # than 4 * TMAX (20sec by default). Therefore, if you set the polling interval
- # to something around or greater than 80sec, this will cause the frontend to
- # incorrectly display hosts as down even though they are not.
- #
- # A list of machines which service the data source follows, in the
- # format ip:port, or name:port. If a port is not specified then 8649
- # (the default gmond port) is assumed.
- # default: There is no default value
- #
- # data_source "my cluster" 10 localhost my.machine.edu:8649 1.2.3.5:8655
- # data_source "my grid" 50 1.3.4.7:8655 grid.org:8651 grid-backup.org:8651
- # data_source "another source" 1.3.4.7:8655 1.3.4.8
- data_source "hadoop-cluster" 10 master:8649 slave:8649
- setuid_username "nobody"
- rrd_rootdir "/var/lib/ganglia/rrds"
- gridname "hadoop-cluster"
- #
- # Round-Robin Archives
- # You can specify custom Round-Robin archives here (defaults are listed below)
- #
- # Old Default RRA: Keep 1 hour of metrics at 15 second resolution. 1 day at 6 minute
- # RRAs "RRA:AVERAGE:0.5:1:244" "RRA:AVERAGE:0.5:24:244" "RRA:AVERAGE:0.5:168:244" "RRA:AVERAGE:0.5:672:244" \
- # "RRA:AVERAGE:0.5:5760:374"
- # New Default RRA
- # Keep 5856 data points at 15 second resolution assuming 15 second (default) polling. That's 1 day
- # Two weeks of data points at 1 minute resolution (average)
- #RRAs "RRA:AVERAGE:0.5:1:5856" "RRA:AVERAGE:0.5:4:20160" "RRA:AVERAGE:0.5:40:52704"
- #
- #-------------------------------------------------------------------------------
- # Scalability mode. If on, we summarize over downstream grids, and respect
- # authority tags. If off, we take on 2.5.0-era behavior: we do not wrap our output
- # in <GRID></GRID> tags, we ignore all <GRID> tags we see, and always assume
- # we are the "authority" on data source feeds. This approach does not scale to
- # large groups of clusters, but is provided for backwards compatibility.
- # default: on
- # scalable off
- #
- #-------------------------------------------------------------------------------
- # The name of this Grid. All the data sources above will be wrapped in a GRID
- # tag with this name.
- # default: unspecified
- # gridname "MyGrid"
- #
- #-------------------------------------------------------------------------------
- # The authority URL for this grid. Used by other gmetads to locate graphs
- # for our data sources. Generally points to a ganglia/
- # website on this machine.
- # default: "http://hostname/ganglia/",
- # where hostname is the name of this machine, as defined by gethostname().
- # authority "http://mycluster.org/newprefix/"
- #
- #-------------------------------------------------------------------------------
- # List of machines this gmetad will share XML with. Localhost
- # is always trusted.
- # default: There is no default value
- # trusted_hosts 127.0.0.1 169.229.50.165 my.gmetad.org
- #
- #-------------------------------------------------------------------------------
- # If you want any host which connects to the gmetad XML to receive
- # data, then set this value to "on"
- # default: off
- # all_trusted on
- #
- #-------------------------------------------------------------------------------
- # If you don't want gmetad to setuid then set this to off
- # default: on
- # setuid off
- #
- #-------------------------------------------------------------------------------
- # User gmetad will setuid to (defaults to "nobody")
- # default: "nobody"
- # setuid_username "nobody"
- #
- #-------------------------------------------------------------------------------
- # Umask to apply to created rrd files and grid directory structure
- # default: 0 (files are public)
- # umask 022
- #
- #-------------------------------------------------------------------------------
- # The port gmetad will answer requests for XML
- # default: 8651
- # xml_port 8651
- #
- #-------------------------------------------------------------------------------
- # The port gmetad will answer queries for XML. This facility allows
- # simple subtree and summation views of the XML tree.
- # default: 8652
- # interactive_port 8652
- #
- #-------------------------------------------------------------------------------
- # The number of threads answering XML requests
- # default: 4
- # server_threads 10
- #
- #-------------------------------------------------------------------------------
- # Where gmetad stores its round-robin databases
- # default: "/var/lib/ganglia/rrds"
- # rrd_rootdir "/some/other/place"
- #
- #-------------------------------------------------------------------------------
- # In earlier versions of gmetad, hostnames were handled in a case
- # sensitive manner
- # If your hostname directories have been renamed to lower case,
- # set this option to 0 to disable backward compatibility.
- # From version 3.2, backwards compatibility will be disabled by default.
- # default: 1 (for gmetad < 3.2)
- # default: 0 (for gmetad >= 3.2)
- case_sensitive_hostnames 0
- #-------------------------------------------------------------------------------
- # It is now possible to export all the metrics collected by gmetad directly to
- # graphite by setting the following attributes.
- #
- # The hostname or IP address of the Graphite server
- # default: unspecified
- # carbon_server "my.graphite.box"
- #
- # The port on which Graphite is listening
- # default: 2003
- # carbon_port 2003
- #
- # A prefix to prepend to the metric names exported by gmetad. Graphite uses dot-
- # separated paths to organize and refer to metrics.
- # default: unspecified
- # graphite_prefix "datacenter1.gmetad"
- #
- # Number of milliseconds gmetad will wait for a response from the graphite server
- # default: 500
- # carbon_timeout 500
- #
- master-gmond.conf.md Raw
master节点gmond.conf配置
- /* This configuration is as close to 2.5.x default behavior as possible
- The values closely match ./gmond/metric.h definitions in 2.5.x */
- globals {
- daemonize = yes
- setuid = yes
- user = ganglia
- debug_level = 0
- max_udp_msg_len = 1472
- mute = no
- deaf = no
- host_dmax = 0 /*secs */
- cleanup_threshold = 300 /*secs */
- gexec = no
- send_metadata_interval = 10
- }
- /* If a cluster attribute is specified, then all gmond hosts are wrapped inside
- * of a <CLUSTER> tag. If you do not specify a cluster tag, then all <HOSTS> will
- * NOT be wrapped inside of a <CLUSTER> tag. */
- cluster {
- name = "hadoop-cluster"
- owner = "ganglia"
- latlong = "unspecified"
- url = "unspecified"
- }
- /* The host section describes attributes of the host, like the location */
- host {
- location = "unspecified"
- }
- /* Feel free to specify as many udp_send_channels as you like. Gmond
- used to only support having a single channel */
- udp_send_channel {
- #mcast_join = 239.2.11.71
- host = master
- port = 8649
- ttl = 1
- }
- /* You can specify as many udp_recv_channels as you like as well. */
- udp_recv_channel {
- #mcast_join = 239.2.11.71
- port = 8649
- #bind = 239.2.11.71
- }
- /* You can specify as many tcp_accept_channels as you like to share
- an xml description of the state of the cluster */
- tcp_accept_channel {
- port = 8649
- }
- /* Each metrics module that is referenced by gmond must be specified and
- loaded. If the module has been statically linked with gmond, it does not
- require a load path. However all dynamically loadable modules must include
- a load path. */
- modules {
- module {
- name = "core_metrics"
- }
- module {
- name = "cpu_module"
- path = "/usr/lib/ganglia/modcpu.so"
- }
- module {
- name = "disk_module"
- path = "/usr/lib/ganglia/moddisk.so"
- }
- module {
- name = "load_module"
- path = "/usr/lib/ganglia/modload.so"
- }
- module {
- name = "mem_module"
- path = "/usr/lib/ganglia/modmem.so"
- }
- module {
- name = "net_module"
- path = "/usr/lib/ganglia/modnet.so"
- }
- module {
- name = "proc_module"
- path = "/usr/lib/ganglia/modproc.so"
- }
- module {
- name = "sys_module"
- path = "/usr/lib/ganglia/modsys.so"
- }
- }
- include ('/etc/ganglia/conf.d/*.conf')
- /* The old internal 2.5.x metric array has been replaced by the following
- collection_group directives. What follows is the default behavior for
- collecting and sending metrics that is as close to 2.5.x behavior as
- possible. */
- /* This collection group will cause a heartbeat (or beacon) to be sent every
- 20 seconds. In the heartbeat is the GMOND_STARTED data which expresses
- the age of the running gmond. */
- collection_group {
- collect_once = yes
- time_threshold = 20
- metric {
- name = "heartbeat"
- }
- }
- /* This collection group will send general info about this host every 1200 secs.
- This information doesn't change between reboots and is only collected once. */
- collection_group {
- collect_once = yes
- time_threshold = 1200
- metric {
- name = "cpu_num"
- title = "CPU Count"
- }
- metric {
- name = "cpu_speed"
- title = "CPU Speed"
- }
- metric {
- name = "mem_total"
- title = "Memory Total"
- }
- /* Should this be here? Swap can be added/removed between reboots. */
- metric {
- name = "swap_total"
- title = "Swap Space Total"
- }
- metric {
- name = "boottime"
- title = "Last Boot Time"
- }
- metric {
- name = "machine_type"
- title = "Machine Type"
- }
- metric {
- name = "os_name"
- title = "Operating System"
- }
- metric {
- name = "os_release"
- title = "Operating System Release"
- }
- metric {
- name = "location"
- title = "Location"
- }
- }
- /* This collection group will send the status of gexecd for this host every 300 secs */
- /* Unlike 2.5.x the default behavior is to report gexecd OFF. */
- collection_group {
- collect_once = yes
- time_threshold = 300
- metric {
- name = "gexec"
- title = "Gexec Status"
- }
- }
- /* This collection group will collect the CPU status info every 20 secs.
- The time threshold is set to 90 seconds. In honesty, this time_threshold could be
- set significantly higher to reduce unneccessary network chatter. */
- collection_group {
- collect_every = 20
- time_threshold = 90
- /* CPU status */
- metric {
- name = "cpu_user"
- value_threshold = "1.0"
- title = "CPU User"
- }
- metric {
- name = "cpu_system"
- value_threshold = "1.0"
- title = "CPU System"
- }
- metric {
- name = "cpu_idle"
- value_threshold = "5.0"
- title = "CPU Idle"
- }
- metric {
- name = "cpu_nice"
- value_threshold = "1.0"
- title = "CPU Nice"
- }
- metric {
- name = "cpu_aidle"
- value_threshold = "5.0"
- title = "CPU aidle"
- }
- metric {
- name = "cpu_wio"
- value_threshold = "1.0"
- title = "CPU wio"
- }
- /* The next two metrics are optional if you want more detail...
- ... since they are accounted for in cpu_system.
- metric {
- name = "cpu_intr"
- value_threshold = "1.0"
- title = "CPU intr"
- }
- metric {
- name = "cpu_sintr"
- value_threshold = "1.0"
- title = "CPU sintr"
- }
- */
- }
- collection_group {
- collect_every = 20
- time_threshold = 90
- /* Load Averages */
- metric {
- name = "load_one"
- value_threshold = "1.0"
- title = "One Minute Load Average"
- }
- metric {
- name = "load_five"
- value_threshold = "1.0"
- title = "Five Minute Load Average"
- }
- metric {
- name = "load_fifteen"
- value_threshold = "1.0"
- title = "Fifteen Minute Load Average"
- }
- }
- /* This group collects the number of running and total processes */
- collection_group {
- collect_every = 80
- time_threshold = 950
- metric {
- name = "proc_run"
- value_threshold = "1.0"
- title = "Total Running Processes"
- }
- metric {
- name = "proc_total"
- value_threshold = "1.0"
- title = "Total Processes"
- }
- }
- /* This collection group grabs the volatile memory metrics every 40 secs and
- sends them at least every 180 secs. This time_threshold can be increased
- significantly to reduce unneeded network traffic. */
- collection_group {
- collect_every = 40
- time_threshold = 180
- metric {
- name = "mem_free"
- value_threshold = "1024.0"
- title = "Free Memory"
- }
- metric {
- name = "mem_shared"
- value_threshold = "1024.0"
- title = "Shared Memory"
- }
- metric {
- name = "mem_buffers"
- value_threshold = "1024.0"
- title = "Memory Buffers"
- }
- metric {
- name = "mem_cached"
- value_threshold = "1024.0"
- title = "Cached Memory"
- }
- metric {
- name = "swap_free"
- value_threshold = "1024.0"
- title = "Free Swap Space"
- }
- }
- collection_group {
- collect_every = 40
- time_threshold = 300
- metric {
- name = "bytes_out"
- value_threshold = 4096
- title = "Bytes Sent"
- }
- metric {
- name = "bytes_in"
- value_threshold = 4096
- title = "Bytes Received"
- }
- metric {
- name = "pkts_in"
- value_threshold = 256
- title = "Packets Received"
- }
- metric {
- name = "pkts_out"
- value_threshold = 256
- title = "Packets Sent"
- }
- }
- /* Different than 2.5.x default since the old config made no sense */
- collection_group {
- collect_every = 1800
- time_threshold = 3600
- metric {
- name = "disk_total"
- value_threshold = 1.0
- title = "Total Disk Space"
- }
- }
- collection_group {
- collect_every = 40
- time_threshold = 180
- metric {
- name = "disk_free"
- value_threshold = 1.0
- title = "Disk Space Available"
- }
- metric {
- name = "part_max_used"
- value_threshold = 1.0
- title = "Maximum Disk Space Used"
- }
- }
- master-hadoop-metrics2-hbase.properties.md Raw
- master节点hadoop-metrics2-hbase.properties配置
- # syntax: [prefix].[source|sink].[instance].[options]
- # See javadoc of package-info.java for org.apache.hadoop.metrics2 for details
- #*.sink.file*.class=org.apache.hadoop.metrics2.sink.FileSink
- # default sampling period
- #*.period=10
- # Below are some examples of sinks that could be used
- # to monitor different hbase daemons.
- # hbase.sink.file-all.class=org.apache.hadoop.metrics2.sink.FileSink
- # hbase.sink.file-all.filename=all.metrics
- # hbase.sink.file0.class=org.apache.hadoop.metrics2.sink.FileSink
- # hbase.sink.file0.context=hmaster
- # hbase.sink.file0.filename=master.metrics
- # hbase.sink.file1.class=org.apache.hadoop.metrics2.sink.FileSink
- # hbase.sink.file1.context=thrift-one
- # hbase.sink.file1.filename=thrift-one.metrics
- # hbase.sink.file2.class=org.apache.hadoop.metrics2.sink.FileSink
- # hbase.sink.file2.context=thrift-two
- # hbase.sink.file2.filename=thrift-one.metrics
- # hbase.sink.file3.class=org.apache.hadoop.metrics2.sink.FileSink
- # hbase.sink.file3.context=rest
- # hbase.sink.file3.filename=rest.metrics
- *.sink.ganglia.class=org.apache.hadoop.metrics2.sink.ganglia.GangliaSink31
- *.sink.ganglia.period=10
- hbase.sink.ganglia.period=10
- hbase.sink.ganglia.servers=master:8649
- master-hadoop-metrics2.properties.md Raw
- master节点hadoop-metrics2.properties配置
- #
- # Licensed to the Apache Software Foundation (ASF) under one or more
- # contributor license agreements. See the NOTICE file distributed with
- # this work for additional information regarding copyright ownership.
- # The ASF licenses this file to You under the Apache License, Version 2.0
- # (the "License"); you may not use this file except in compliance with
- # the License. You may obtain a copy of the License at
- #
- # http://www.apache.org/licenses/LICENSE-2.0
- #
- # Unless required by applicable law or agreed to in writing, software
- # distributed under the License is distributed on an "AS IS" BASIS,
- # WITHOUT WARRANTIES OR CONDITIONS OF ANY KIND, either express or implied.
- # See the License for the specific language governing permissions and
- # limitations under the License.
- #
- # syntax: [prefix].[source|sink].[instance].[options]
- # See javadoc of package-info.java for org.apache.hadoop.metrics2 for details
- #*.sink.file.class=org.apache.hadoop.metrics2.sink.FileSink
- # default sampling period, in seconds
- #*.period=10
- # The namenode-metrics.out will contain metrics from all context
- #namenode.sink.file.filename=namenode-metrics.out
- # Specifying a special sampling period for namenode:
- #namenode.sink.*.period=8
- #datanode.sink.file.filename=datanode-metrics.out
- # the following example split metrics of different
- # context to different sinks (in this case files)
- #jobtracker.sink.file_jvm.context=jvm
- #jobtracker.sink.file_jvm.filename=jobtracker-jvm-metrics.out
- #jobtracker.sink.file_mapred.context=mapred
- #jobtracker.sink.file_mapred.filename=jobtracker-mapred-metrics.out
- #tasktracker.sink.file.filename=tasktracker-metrics.out
- #maptask.sink.file.filename=maptask-metrics.out
- #reducetask.sink.file.filename=reducetask-metrics.out
- *.sink.ganglia.class=org.apache.hadoop.metrics2.sink.ganglia.GangliaSink31
- *.sink.ganglia.period=10
- *.sink.ganglia.slope=jvm.metrics.gcCount=zero,jvm.metrics.memHeapUsedM=both
- *.sink.ganglia.dmax=jvm.metrics.threadsBlocked=70,jvm.metrics.memHeapUsedM=40
- namenode.sink.ganglia.servers=master:8649
- resourcemanager.sink.ganglia.servers=master:8649
- datanode.sink.ganglia.servers=master:8649
- nodemanager.sink.ganglia.servers=master:8649
- maptask.sink.ganglia.servers=master:8649
- reducetask.sink.ganglia.servers=master:8649
- slave-gmond.conf.md Raw
- slave节点gmond.conf配置
- /* This configuration is as close to 2.5.x default behavior as possible
- The values closely match ./gmond/metric.h definitions in 2.5.x */
- globals {
- daemonize = yes
- setuid = yes
- user = ganglia
- debug_level = 0
- max_udp_msg_len = 1472
- mute = no
- deaf = no
- host_dmax = 0 /*secs */
- cleanup_threshold = 300 /*secs */
- gexec = no
- send_metadata_interval = 10
- }
- /* If a cluster attribute is specified, then all gmond hosts are wrapped inside
- * of a <CLUSTER> tag. If you do not specify a cluster tag, then all <HOSTS> will
- * NOT be wrapped inside of a <CLUSTER> tag. */
- cluster {
- name = "hadoop-cluster"
- owner = "ganglia"
- latlong = "unspecified"
- url = "unspecified"
- }
- /* The host section describes attributes of the host, like the location */
- host {
- location = "unspecified"
- }
- /* Feel free to specify as many udp_send_channels as you like. Gmond
- used to only support having a single channel */
- udp_send_channel {
- #mcast_join = 239.2.11.71
- host = master
- port = 8649
- ttl = 1
- }
- /* You can specify as many udp_recv_channels as you like as well. */
- udp_recv_channel {
- #mcast_join = 239.2.11.71
- port = 8649
- #bind = 239.2.11.71
- }
- /* You can specify as many tcp_accept_channels as you like to share
- an xml description of the state of the cluster */
- tcp_accept_channel {
- port = 8649
- }
- /* Each metrics module that is referenced by gmond must be specified and
- loaded. If the module has been statically linked with gmond, it does not
- require a load path. However all dynamically loadable modules must include
- a load path. */
- modules {
- module {
- name = "core_metrics"
- }
- module {
- name = "cpu_module"
- path = "/usr/lib/ganglia/modcpu.so"
- }
- module {
- name = "disk_module"
- path = "/usr/lib/ganglia/moddisk.so"
- }
- module {
- name = "load_module"
- path = "/usr/lib/ganglia/modload.so"
- }
- module {
- name = "mem_module"
- path = "/usr/lib/ganglia/modmem.so"
- }
- module {
- name = "net_module"
- path = "/usr/lib/ganglia/modnet.so"
- }
- module {
- name = "proc_module"
- path = "/usr/lib/ganglia/modproc.so"
- }
- module {
- name = "sys_module"
- path = "/usr/lib/ganglia/modsys.so"
- }
- }
- include ('/etc/ganglia/conf.d/*.conf')
- /* The old internal 2.5.x metric array has been replaced by the following
- collection_group directives. What follows is the default behavior for
- collecting and sending metrics that is as close to 2.5.x behavior as
- possible. */
- /* This collection group will cause a heartbeat (or beacon) to be sent every
- 20 seconds. In the heartbeat is the GMOND_STARTED data which expresses
- the age of the running gmond. */
- collection_group {
- collect_once = yes
- time_threshold = 20
- metric {
- name = "heartbeat"
- }
- }
- /* This collection group will send general info about this host every 1200 secs.
- This information doesn't change between reboots and is only collected once. */
- collection_group {
- collect_once = yes
- time_threshold = 1200
- metric {
- name = "cpu_num"
- title = "CPU Count"
- }
- metric {
- name = "cpu_speed"
- title = "CPU Speed"
- }
- metric {
- name = "mem_total"
- title = "Memory Total"
- }
- /* Should this be here? Swap can be added/removed between reboots. */
- metric {
- name = "swap_total"
- title = "Swap Space Total"
- }
- metric {
- name = "boottime"
- title = "Last Boot Time"
- }
- metric {
- name = "machine_type"
- title = "Machine Type"
- }
- metric {
- name = "os_name"
- title = "Operating System"
- }
- metric {
- name = "os_release"
- title = "Operating System Release"
- }
- metric {
- name = "location"
- title = "Location"
- }
- }
- /* This collection group will send the status of gexecd for this host every 300 secs */
- /* Unlike 2.5.x the default behavior is to report gexecd OFF. */
- collection_group {
- collect_once = yes
- time_threshold = 300
- metric {
- name = "gexec"
- title = "Gexec Status"
- }
- }
- /* This collection group will collect the CPU status info every 20 secs.
- The time threshold is set to 90 seconds. In honesty, this time_threshold could be
- set significantly higher to reduce unneccessary network chatter. */
- collection_group {
- collect_every = 20
- time_threshold = 90
- /* CPU status */
- metric {
- name = "cpu_user"
- value_threshold = "1.0"
- title = "CPU User"
- }
- metric {
- name = "cpu_system"
- value_threshold = "1.0"
- title = "CPU System"
- }
- metric {
- name = "cpu_idle"
- value_threshold = "5.0"
- title = "CPU Idle"
- }
- metric {
- name = "cpu_nice"
- value_threshold = "1.0"
- title = "CPU Nice"
- }
- metric {
- name = "cpu_aidle"
- value_threshold = "5.0"
- title = "CPU aidle"
- }
- metric {
- name = "cpu_wio"
- value_threshold = "1.0"
- title = "CPU wio"
- }
- /* The next two metrics are optional if you want more detail...
- ... since they are accounted for in cpu_system.
- metric {
- name = "cpu_intr"
- value_threshold = "1.0"
- title = "CPU intr"
- }
- metric {
- name = "cpu_sintr"
- value_threshold = "1.0"
- title = "CPU sintr"
- }
- */
- }
- collection_group {
- collect_every = 20
- time_threshold = 90
- /* Load Averages */
- metric {
- name = "load_one"
- value_threshold = "1.0"
- title = "One Minute Load Average"
- }
- metric {
- name = "load_five"
- value_threshold = "1.0"
- title = "Five Minute Load Average"
- }
- metric {
- name = "load_fifteen"
- value_threshold = "1.0"
- title = "Fifteen Minute Load Average"
- }
- }
- /* This group collects the number of running and total processes */
- collection_group {
- collect_every = 80
- time_threshold = 950
- metric {
- name = "proc_run"
- value_threshold = "1.0"
- title = "Total Running Processes"
- }
- metric {
- name = "proc_total"
- value_threshold = "1.0"
- title = "Total Processes"
- }
- }
- /* This collection group grabs the volatile memory metrics every 40 secs and
- sends them at least every 180 secs. This time_threshold can be increased
- significantly to reduce unneeded network traffic. */
- collection_group {
- collect_every = 40
- time_threshold = 180
- metric {
- name = "mem_free"
- value_threshold = "1024.0"
- title = "Free Memory"
- }
- metric {
- name = "mem_shared"
- value_threshold = "1024.0"
- title = "Shared Memory"
- }
- metric {
- name = "mem_buffers"
- value_threshold = "1024.0"
- title = "Memory Buffers"
- }
- metric {
- name = "mem_cached"
- value_threshold = "1024.0"
- title = "Cached Memory"
- }
- metric {
- name = "swap_free"
- value_threshold = "1024.0"
- title = "Free Swap Space"
- }
- }
- collection_group {
- collect_every = 40
- time_threshold = 300
- metric {
- name = "bytes_out"
- value_threshold = 4096
- title = "Bytes Sent"
- }
- metric {
- name = "bytes_in"
- value_threshold = 4096
- title = "Bytes Received"
- }
- metric {
- name = "pkts_in"
- value_threshold = 256
- title = "Packets Received"
- }
- metric {
- name = "pkts_out"
- value_threshold = 256
- title = "Packets Sent"
- }
- }
- /* Different than 2.5.x default since the old config made no sense */
- collection_group {
- collect_every = 1800
- time_threshold = 3600
- metric {
- name = "disk_total"
- value_threshold = 1.0
- title = "Total Disk Space"
- }
- }
- collection_group {
- collect_every = 40
- time_threshold = 180
- metric {
- name = "disk_free"
- value_threshold = 1.0
- title = "Disk Space Available"
- }
- metric {
- name = "part_max_used"
- value_threshold = 1.0
- title = "Maximum Disk Space Used"
- }
- }
- slave-hadoop-metrics2-hbase.properties.md Raw
- slave节点hadoop-metrics2-hbase.properties配置
- # syntax: [prefix].[source|sink].[instance].[options]
- # See javadoc of package-info.java for org.apache.hadoop.metrics2 for details
- #*.sink.file*.class=org.apache.hadoop.metrics2.sink.FileSink
- # default sampling period
- #*.period=10
- # Below are some examples of sinks that could be used
- # to monitor different hbase daemons.
- # hbase.sink.file-all.class=org.apache.hadoop.metrics2.sink.FileSink
- # hbase.sink.file-all.filename=all.metrics
- # hbase.sink.file0.class=org.apache.hadoop.metrics2.sink.FileSink
- # hbase.sink.file0.context=hmaster
- # hbase.sink.file0.filename=master.metrics
- # hbase.sink.file1.class=org.apache.hadoop.metrics2.sink.FileSink
- # hbase.sink.file1.context=thrift-one
- # hbase.sink.file1.filename=thrift-one.metrics
- # hbase.sink.file2.class=org.apache.hadoop.metrics2.sink.FileSink
- # hbase.sink.file2.context=thrift-two
- # hbase.sink.file2.filename=thrift-one.metrics
- # hbase.sink.file3.class=org.apache.hadoop.metrics2.sink.FileSink
- # hbase.sink.file3.context=rest
- # hbase.sink.file3.filename=rest.metrics
- *.sink.ganglia.class=org.apache.hadoop.metrics2.sink.ganglia.GangliaSink31
- *.sink.ganglia.period=10
- hbase.sink.ganglia.period=10
- hbase.sink.ganglia.servers=master:8649
- slave-hadoop-metrics2.properties.md Raw
- slave节点hadoop-metrics2.properties配置
- #
- # Licensed to the Apache Software Foundation (ASF) under one or more
- # contributor license agreements. See the NOTICE file distributed with
- # this work for additional information regarding copyright ownership.
- # The ASF licenses this file to You under the Apache License, Version 2.0
- # (the "License"); you may not use this file except in compliance with
- # the License. You may obtain a copy of the License at
- #
- # http://www.apache.org/licenses/LICENSE-2.0
- #
- # Unless required by applicable law or agreed to in writing, software
- # distributed under the License is distributed on an "AS IS" BASIS,
- # WITHOUT WARRANTIES OR CONDITIONS OF ANY KIND, either express or implied.
- # See the License for the specific language governing permissions and
- # limitations under the License.
- #
- # syntax: [prefix].[source|sink].[instance].[options]
- # See javadoc of package-info.java for org.apache.hadoop.metrics2 for details
- #*.sink.file.class=org.apache.hadoop.metrics2.sink.FileSink
- # default sampling period, in seconds
- #*.period=10
- # The namenode-metrics.out will contain metrics from all context
- #namenode.sink.file.filename=namenode-metrics.out
- # Specifying a special sampling period for namenode:
- #namenode.sink.*.period=8
- #datanode.sink.file.filename=datanode-metrics.out
- # the following example split metrics of different
- # context to different sinks (in this case files)
- #jobtracker.sink.file_jvm.context=jvm
- #jobtracker.sink.file_jvm.filename=jobtracker-jvm-metrics.out
- #jobtracker.sink.file_mapred.context=mapred
- #jobtracker.sink.file_mapred.filename=jobtracker-mapred-metrics.out
- #tasktracker.sink.file.filename=tasktracker-metrics.out
- #maptask.sink.file.filename=maptask-metrics.out
- #reducetask.sink.file.filename=reducetask-metrics.out
- *.sink.ganglia.class=org.apache.hadoop.metrics2.sink.ganglia.GangliaSink31
- *.sink.ganglia.period=10
- *.sink.ganglia.slope=jvm.metrics.gcCount=zero,jvm.metrics.memHeapUsedM=both
- *.sink.ganglia.dmax=jvm.metrics.threadsBlocked=70,jvm.metrics.memHeapUsedM=40
- namenode.sink.ganglia.servers=master:8649
- resourcemanager.sink.ganglia.servers=master:8649
- datanode.sink.ganglia.servers=master:8649
- nodemanager.sink.ganglia.servers=master:8649
- maptask.sink.ganglia.servers=master:8649
- reducetask.sink.ganglia.servers=master:8649
0 0
- Ganglia监控hadoop、hbase集群
- 使用ganglia监控hadoop及hbase集群
- 使用ganglia监控hadoop及hbase集群
- 使用ganglia监控hadoop及hbase集群
- Ganglia监控Hadoop与HBase集群
- HBase总结(十七)Ganglia监控hadoop、hbase集群
- ganglia监控hadoop集群
- Ganglia监控Hadoop及Hbase集群性能(安装配置)
- wang-----Ganglia监控Hadoop及Hbase集群性能(安装配置)
- Ganglia监控Hadoop及Hbase集群性能(安装配置)
- Ubuntu1604安装ganglia并监控Hadoop/HBase/Spark集群
- Ganglia监控Hadoop及Hbase集群性能(安装配置)
- 使用Ganglia监控Hadoop,hbase
- 使用ganglia监控hadoop,hbase
- 用 Ganglia 监控hadoop集群
- 用 Ganglia 监控hadoop集群
- 用 Ganglia 监控hadoop集群
- 用 Ganglia 监控hadoop集群
- MySQL常用的面试题
- 运行项目时报错
- junit
- imageName:与imageWithContentsOfFile:区别
- 数据结构以孩子兄弟链存储的树的高度
- Ganglia监控hadoop、hbase集群
- iOS开发中的内存管理
- 操作系统的进程调度算法
- 使用android studio开发时支持Lambda语法
- 动态添加综合布局---动态添加控件及将某XML动态加入到Activity显示(续)
- cmcc访问一些国外网站访问不了
- Javascript正则表达式完全学习手册
- iOS地图定位使用几个小功能
- Memcached简介及优缺点