使用leaflet或者openlayers 3 调用MapServer服务最佳实践完整说明
来源:互联网 发布:淘宝网板鞋 编辑:程序博客网 时间:2024/05/29 13:37
最近尝试了很多次,看到网上的很多教程都是版本比较老旧,会出现很多问题。经过数天的实践,现在可以调用成功,遂将步骤记录在此。
为避免以后使用的软件不兼容,首先给出基于window 10的软件版本:
- MapServer服务器 3.2.1 ms4w-3.2.1-setup.exe
http://www.ms4w.com/
- QGIS 2.18 osgeo4w-setup-x86_64.exe
http://www.qgis.org/en/site/forusers/download.html
所有配置和示例我都放在了github仓库中mapserver-leaflet-openlayers。
https://github.com/zrysmt/mapserver-leaflet-openlayers
1.安装说明
1.1 ms4w-3.2.1-setup.exe
Windows平台MapServer (MS4W)安装Windows平台MapServer (MS4W)安装
http://blog.csdn.net/u010924834/article/details/53434322
http://mapserver.org/de/introduction.html
MapServer的安装包(ms4w.zip,解压到根目录下)里内置了Apache,不过因为IIS占用了80的端口,所以需要设置下端口 (在\ms4w\Apache\conf\ httpd.conf中,将Listen 80改为Listen 8081)
1.2 osgeo4w-setup-x86_64.exe
因为刚开始值安装了Destop桌面端,后来出了问题,无奈废了很大的劲又卸载了重新安装的。这里建议全部安装,选择Advanced Install 点击选择全部安装即可。
1.3 QGIS几个重要的插件
安装插件
qGIS菜单栏plugin–>Manager and Install Plugin
1.qgis2web
会导出一个完整的网页结构 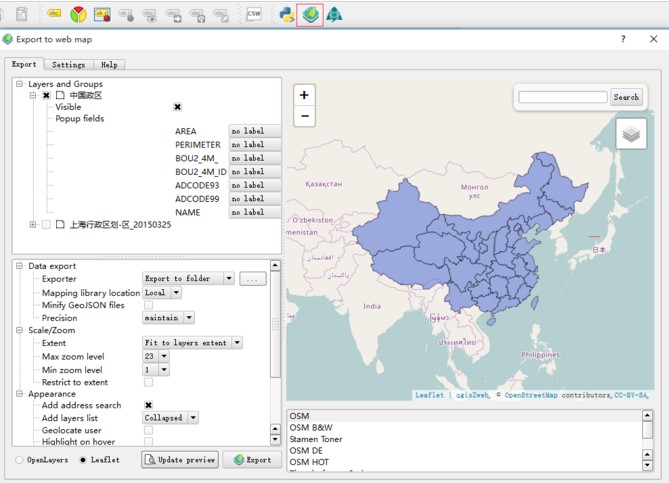
【Update perview】可以更换坐标系
【Export】导出即可
导出后会打开一个网页,我们需要的是data文件夹下的js,里面有geoJson数据
2.RT Mapfile Export
这是我们发布地图服务的重要的插件
使用插件的时候注意先设置好,打开Manager and Install Plugin对话框,注意在设置中勾选住实验性的插件一项,再搜索插件并进行安装。
2.发布服务
安装好RT Mapfile Export插件后,我们就可以使用QGIS导出Mapfile文件用来发布服务了。
坐标系
首先重要的一点是坐标系一定要选择好。如果不满足,可以使用QGIS工具Reproject Layer转换坐标系。目前常用的是EPSG:3857 墨卡托坐标系和EPSG:4326 WGS84坐标系,这里我们就以3857坐标系为例。
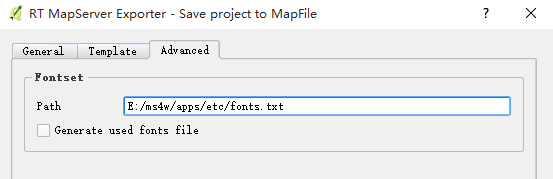
MapFile
在发布服务方面,MapServer有一个和mxd(ArcGIS)类似的map文件来描述地图的图层及样式,不同的是,在使用地图服务的时候,调用的url中需要知道map文件的位置,而ArcGIS则不需要
关于MapFile,这里就不单独介绍太多,Mapfile的作用如下图所示。 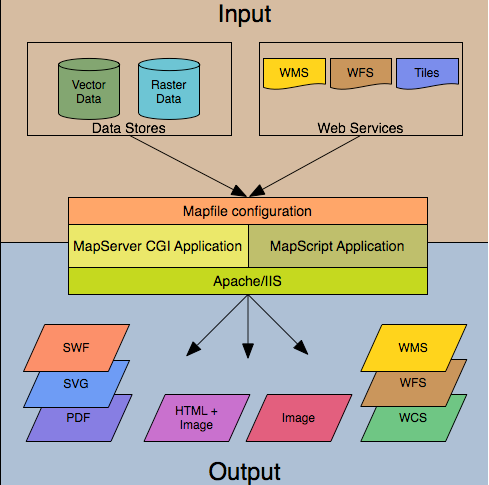
基本介绍:
http://blog.csdn.net/qingyafan/article/details/46500127
MapServer 快速入门文档:
http://live.osgeo.org/zh/quickstart/mapserver_quickstart.html
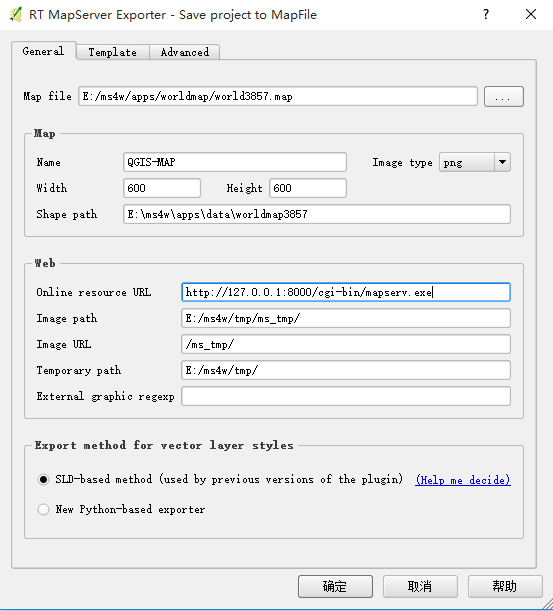
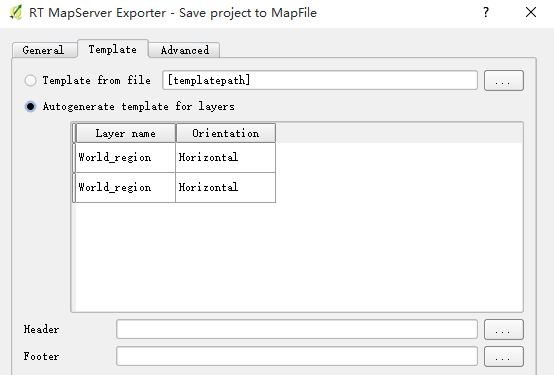
发布过程
因为我把发布的服务器端口改为8000了,所以Online resource url地址是http://127.0.0.1:8000/cgi-bin/mapserv.exe
1. 
2. 
3. 
【确定】即可生成mapfile文件,在本文末尾会给出.
mapfile文件地址在E:\ms4w\apps\worldmap中。
我们在浏览器中输入地址http://127.0.0.1:8000/cgi-bin/mapserv.exe?MAP=E:/ms4w/apps/worldmap/world3857.map&LAYERS=World_region&MODE=MAP
注意:在使用类库调用该WMS服务的时候一定要去掉&MODE=MAP,否则不能成功。 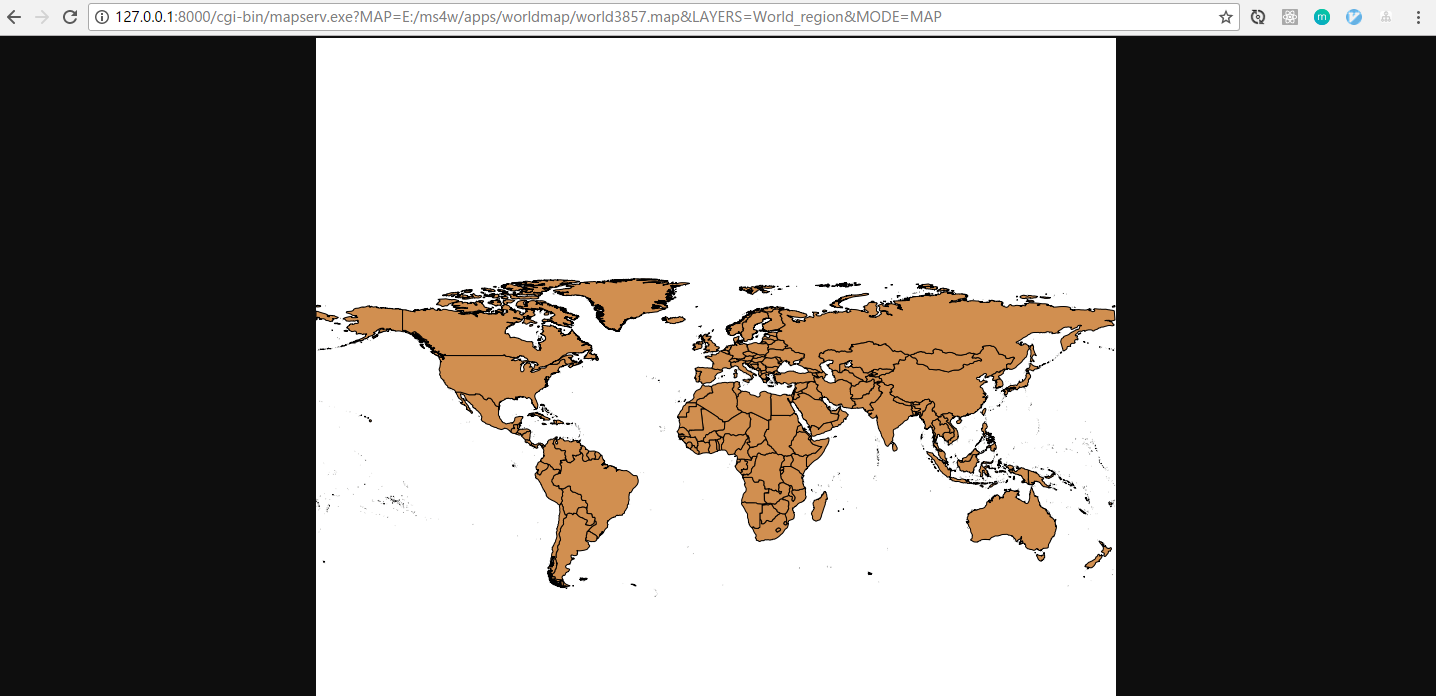
3.使用leaflet或openlayers调用
leaflet示例如下:
<!DOCTYPE html><html lang="en"><head> <meta charset="UTF-8"> <title>leaflet加载MapServer示例子</title> <!-- <link rel="stylesheet" href="../app/common/css/leaflet.css"> --> <link rel="stylesheet" href="https://cdn.bootcss.com/leaflet/1.0.3/leaflet.css"> <style type="text/css"> #map { width: 100%; height: 600px; } </style></head><body> <div id="map"></div> <script src="https://cdn.bootcss.com/leaflet/1.0.3/leaflet-src.js"></script> <!-- <script src="../app/common/leaflet-plugin/leaflet-src.js"></script> --> <script type="text/javascript"> var map = L.map('map', { crs: L.CRS.EPSG3857 }); map.setView([30, 104], 2); // let map = L.map('map').setView([30, 104], 10); //默认墨卡托投影 ESPG:3857 //http://127.0.0.1:8000/cgi-bin/mapserv.exe?MAP=E:/ms4w/apps/test/test.map&LAYERS=ALL&MODE=MAP //一定不要有&MODE=MAP var myDemo = L.tileLayer.wms("http://127.0.0.1:8000/cgi-bin/mapserv.exe?MAP=E:/ms4w/apps/worldmap/world3857.map", { layers: 'World_region', format: 'image/png', transparent: false, crs: L.CRS.EPSG3857, attribution: "自定义地图", }); myDemo.addTo(map); </script></body></html>访问示例如下: 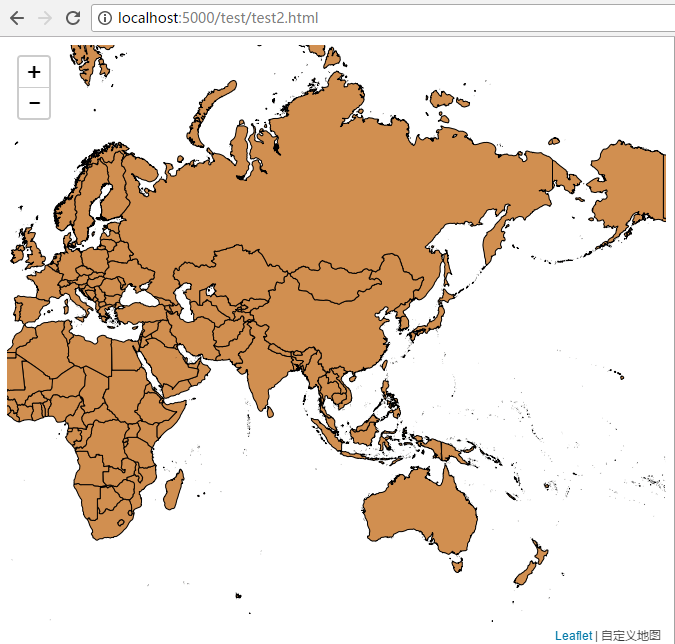
openlayers示例如下:
<!DOCTYPE html><html lang="en"><head> <meta charset="UTF-8"> <title>openlayers 3加载MapServer示例子</title> <link rel="stylesheet" href="https://openlayers.org/en/v4.1.1/css/ol.css" type="text/css"> <style type="text/css"> #map { width: 100%; height: 600px; } </style></head><body> <div id="map"></div> <script src="https://openlayers.org/en/v4.1.1/build/ol.js" type="text/javascript"></script> <script type="text/javascript"> var layers = [ new ol.layer.Tile({ source: new ol.source.OSM() }), new ol.layer.Tile({ source: new ol.source.TileWMS({ url: 'http://127.0.0.1:8000/cgi-bin/mapserv.exe', params: { 'layers': 'World_region', 'MAP': "E:/ms4w/apps/worldmap/world3857.map", 'TILED': true }, serverType: 'mapserver', }) }) ]; var map = new ol.Map({ target: 'map', layers: layers, view: new ol.View({ center: ol.proj.fromLonLat([104, 30]), zoom: 2, projection: 'EPSG:3857' }) }); </script></body></html>访问示例如下: 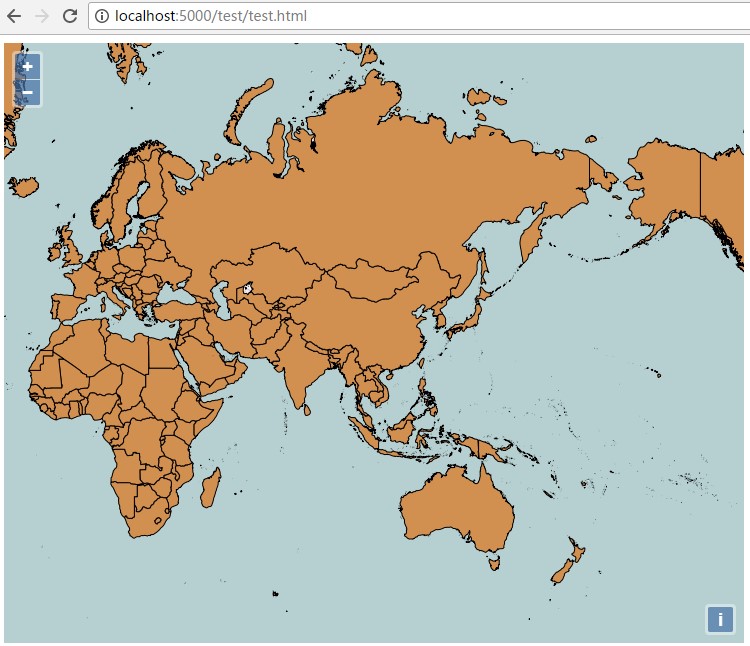
4.附录:mapfile文件world3857.map
MAP FONTSET "E:/ms4w/apps/etc/fonts.txt" EXTENT -179.99942 -59.484295 180 83.627357 IMAGETYPE "png" NAME "QGIS--MAP" SHAPEPATH "E:/ms4w/apps/data/worldmap3857" SIZE 800 800 STATUS ON UNITS DD OUTPUTFORMAT NAME "png" MIMETYPE "image/png" DRIVER "AGG/PNG" EXTENSION "png" IMAGEMODE RGB TRANSPARENT FALSE END # OUTPUTFORMAT PROJECTION "proj=longlat" "datum=WGS84" "no_defs" "init=epsg:3857" END # PROJECTION LEGEND KEYSIZE 20 20 KEYSPACING 5 5 LABEL SIZE MEDIUM OFFSET 0 0 SHADOWSIZE 1 1 TYPE BITMAP END # LABEL STATUS OFF END # LEGEND QUERYMAP SIZE -1 -1 STATUS OFF STYLE HILITE END # QUERYMAP SCALEBAR INTERVALS 4 LABEL SIZE MEDIUM OFFSET 0 0 SHADOWSIZE 1 1 TYPE BITMAP END # LABEL SIZE 200 3 STATUS OFF UNITS MILES END # SCALEBAR WEB FOOTER "" HEADER "" IMAGEPATH "E:/ms4w/tmp/ms_tmp/" TEMPPATH "E:/ms4w/tmp/" IMAGEURL "/tmp/" METADATA "wms_onlineresource" "http://127.0.0.1:8000/cgi-bin/mapserv.exe?map=E:/ms4w/apps/test2/test2.map" "wms_enable_request" "*" "wms_srs" "EPSG:3857" "wms_feature_info_mime_type" "text/html" "wms_format" "image/png" END # METADATA TEMPLATE "E:/ms4w/apps/test2/test.map.html.tmpl" END # WEB LAYER DATA "E:/ms4w/apps/data/worldmap3857/World_region.shp" EXTENT -20037443.7774846 -8285806.11600741 20037508.3427892 18422153.0437227 METADATA "ows_include_items" "all" "ows_extent" "-20037443.7775 -8285806.11601 20037508.3428 18422153.0437" "ows_srs" "EPSG:3857" "ows_title" "World_region" "wms_getfeatureinfo_formatlist" "OGRGML" "wms_bbox_extended" "true" "gml_include_items" "all" END # METADATA NAME "World_region" PROJECTION "proj=merc" "a=6378137" "b=6378137" "lat_ts=0.0" "lon_0=0.0" "x_0=0.0" "y_0=0" "k=1.0" "units=m" "nadgrids=@null" "wktext" "no_defs" END # PROJECTION STATUS ON TILEITEM "location" TYPE POLYGON UNITS METERS CLASS NAME "Single symbol" STYLE COLOR 209 143 80 END # STYLE STYLE OUTLINECOLOR 0 0 1 END # STYLE END # CLASS END # LAYEREND # MAP所有配置和示例我都放在了github仓库中mapserver-leaflet-openlayers。
https://github.com/zrysmt/mapserver-leaflet-openlayers
- 使用leaflet或者openlayers 3 调用MapServer服务最佳实践完整说明
- 使用mapserver+qgis+openlayers搭建webGIS
- 使用mapserver+qgis+openlayers搭建webGIS
- 使用mapserver+qgis+openlayers搭建webGIS
- 使用mapserver+qgis+openlayers搭建webGIS
- OpenLayers调用WMS服务
- TileCache+MapServer+OpenLayers使用方法
- 使用Openlayers调用天地图在线服务数据
- azure 最佳实践 -- 尽量使用托管服务
- 解决openlayers调用mapserver发布的地图出现乱图问题
- Web 服务最佳实践
- 服务化最佳实践
- OpenLayers 3实践与原理探究3-ol3一个完整的例子
- OpenLayers调用天地图在线服务
- 使用Spring RESTful服务接收和返回JSON最佳实践
- 使用react加载leaflet瓦片乱序或者加载不完全
- mapserver+postgis(postgresql) +openlayers发布地图成功
- 服务生命周期最佳实践简介
- Java多线程/并发21、利用Condition来实现阻塞队列
- Shell函数的7种用法介绍 ---待整理
- 南阳理工acm61 传纸条 双线dp
- Linux Kernel 学习笔记8:同步与互斥之信号量
- JS load事件(UI)
- 使用leaflet或者openlayers 3 调用MapServer服务最佳实践完整说明
- BZOJ1012
- OSTaskCreateHook()
- Thinkphp 多库查询
- 根号n分治排序
- Android仿QQ聊天撒花特效
- 我写的第一个用Python写的爬虫
- NYOJ127星际之门(一)_n阶完全图的生成树数目
- cocos creator中使用protobuf(dcodeIO/protobuf.js 5.0)