ubuntu网络调试工具
来源:互联网 发布:indexof( ,) js 编辑:程序博客网 时间:2024/05/16 04:15
在调试gprs模块时,教程里面提示使用网络调试工具先建立一个服务器端的tcp监听端口.然后使用gprs模块来建立连接,发送数据.想到公司当前有现成的阿里云服务器,linux版.就顺势在里面建立一个连接岂不很好.请教了hp.
参考网络命令: nc -l 1234直接建立监听端口. nc -l 1234 > fileout 可以接收数据.
windows: http analyzer fiddler
Ubuntu Network Monitoring Tools
Unlike the admin-targeted Linux distributions, which come with bunches of all sorts of tools, Ubuntu doesn't, simply because it is not meant to be a distribution for administering a network. However, this doesn't mean that you are out of options. You can do quite a lot of network monitoring and here are some ways to do it.
Simple Network Statistics with netstat
One of the easiest ways to get data about the network activity of your computer is with the help of thenetstat command. In a console, type netstat and you will see something like this (the xx-xxx-xxx-xxx being your actual IP):
Active Internet connections (w/o servers)Proto Recv-Q Send-Q Local Address Foreign Address State
tcp 0 0 xx-xxx-xxx-xxx.dd:33796 74.125.232.217:www TIME_WAIT
tcp 0 0 xx-xxx-xxx-xxx.dd:47761 fra07s07-in-f103.1e:www ESTABLISHED
The information isn't very useful but you can see the open connections and their destination (the IP of the party you are connected to). If you are interested only in interfaces, you can use the ifstat tool instead.
More Detailed Network Stats with iptraf
Most likely, the output of the netstat command won't suffice and you will need a more advancedUbuntu network monitoring tool. The choice here is really rich because there are dozens of applications that give more detailed network stats. One of them is iptraf. In order to use it, you first need to install it. In a console, type:
sudo apt-get install iptrafAfter you have installed it, type iptraf to start it. You will see a welcome screen and then you will see its main screen, as shown in the screenshot below:
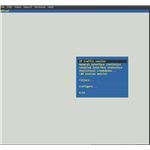
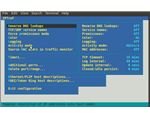
Navigate up and down the menu and check what you want to know. You can set filters and configure the application, so that it monitors exactly what you want it to monitor. The configuration menu is shown in the next screenshot:
 The data gathered and shown by iptraf is very comprehensive and you can even log it for further analysis. This is a lightweight but very useful Ubuntu network monitoring tool. ItsGUI might look archaic but the program itself does a really good job.
Detailed Graphic Stats with BandwidthD
If you don't like the console look and feel of iptraf, you can use BandwidthD to get some basic network stats. This is a modern application you can use not only to gather and perform a preliminary analysis on how your bandwidth is used, but you can capture the output to a database and generate numerous reports from it.
BandwidthD is mainly a bandwidth monitor but it can be used for network monitoring as well. Here is what it can do according to its creators: “BandwidthD tracks usage of TCP/IP network subnets and builds html files with graphs to display utilization. Charts are built by individual IPs, and by default display utilization over 2 day, 8 day, 40 day, and 400 day periods. Furthermore, each ip address's utilization can be logged out at intervals of 3.3 minutes, 10 minutes, 1 hour or 12 hours in cdf format, or to a backend database server. HTTP, TCP, UDP, ICMP, VPN, and P2P traffic are color coded. ".
As you see, BandwidthD is a pretty good solution for network monitoring and unless you need something really sophisticated, it could be the best option for you.
Wireshark – a Powerful Packet Sniffer
Wireshark is a network protocol analyzer, which is a nice way to call a packet sniffer. The purpose ofWireshark is to capture packets – both outgoing and incoming. For statistical and analytical purposes a packet sniffer does a really outstanding job but since it intercepts all traffic and stores copies of it, before you run it, especially on a large network, you need to double check if you have the legal right to do it. Here is what Wireshark looks like:
I am not going to explain in detail all the things you can do with Wireshark but if you know what a packet sniffer is, you will know what this program can do. One of the best things about Wireshark is that it has a truly detailed and useful online documentation, so if you have the patience to read through it, even a novice will be able to use the program successfully.
Kismet – A Wireless Network Sniffer
If you are interested in the wireless part of your network only, then you may want to tryKismet. Go to Administration → Synaptic Package Manager, find Kismet in the list of applications and install it. Unlike the other programs and tools on the list, Kismet isn't universal and can be used only for wireless interfaces.
The Ubuntu network monitoring tools on the list are just a drop in the sea of such tools and I don't claim they are the best. Still, since they do a pretty good job and almost all of them I have been using for years, I can whole-heartedly recommend them. However, if you see that they are not what you need, or if you simply don't like them, feel free to browse the Net for alternatives.
- ubuntu网络调试工具
- Ubuntu LogViewer调试工具
- Ubuntu 串口调试工具
- 网络调试与工具
- 网络调试工具
- 网络调试助手 工具
- TCP_UDP网络调试工具
- 常用网络调试工具
- 网络接口调试工具
- ubuntu 网络调试命令
- Ubuntu下串口调试工具
- Ubuntu下串口调试工具
- ubuntu 串口调试工具cutecom
- Linux 网络编程 调试工具
- Linux 网络编程 调试工具
- linux下网络调试工具
- 一个网络请求调试工具
- Linux网络编程 - 网络调试工具
- 软件测试工具
- 170531 逆向-CrackMe之007
- 编译原理总结
- 用词云做我的头像
- Spring Boot Redis 数据缓存
- ubuntu网络调试工具
- 数据库(一)--基本SQL语句
- PREROUTING 和 POSTROUTING, SNAT 和 DNAT图文解析(非常清淅)
- iOS多线程总结
- python基础笔记-8
- centos系统安装mongdb
- 常见模块设计--权限管理(一)
- 240. Search a 2D Matrix II
- python学习之指定脚本解释器