ELK5.1搭建过程(ElasticSearch, Logstash, Kibana)
来源:互联网 发布:初中数学辅导软件 编辑:程序博客网 时间:2024/05/22 08:24
前言
日志主要包括系统日志、应用程序日志和安全日志。系统运维和开发人员可以通过日志了解服务器软硬件信息、检查配置过程中的错误及错误发生的原因。经常分析日志可以了解服务器的负荷,性能安全性,从而及时采取措施纠正错误。
通常,日志被分散的储存不同的设备上。如果你管理数十上百台服务器,你还在使用依次登录每台机器的传统方法查阅日志,这样是不是感觉很繁琐和效率低下?当务之急我们使用集中化的日志管理,例如:开源的syslog,将所有服务器上的日志收集汇总。
集中化管理日志后,日志的统计和检索又成为一件比较麻烦的事情,一般我们使用grep、awk和wc等Linux命令能实现检索和统计,但是对于要求更高的查询、排序和统计等要求和庞大的机器数量依然使用这样的方法难免有点力不从心。
开源实时日志分析ELK平台能够完美的解决我们上述的问题,ELK由ElasticSearch、Logstash和Kiabana三个开源工具组成。
Elasticsearch是个开源分布式搜索引擎,5.1.2版本下载地址,它的特点有:分布式,零配置,自动发现,索引自动分片,索引副本机制,restful风格接口,多数据源,自动搜索负载等。
Logstash是一个完全开源的工具,5.1.2版本下载地址,他可以对你的日志进行收集、过滤,并将其存储供以后使用(如,搜索)。
Kibana 也是一个开源和免费的工具,5.1.2版本下载地址,它Kibana可以为 Logstash 和 ElasticSearch 提供的日志分析友好的 Web 界面,可以帮助您汇总、分析和搜索重要数据日志。
开源实时日志分析ELK平台(ElasticSearch, Logstash, Kibana组成),能很方便的帮我们收集日志,进行集中化的管理,并且能很方便的进行日志的统计和检索,下面基于ELK的最新版本5.1进行一次整合测试。 官方网站:https://www.elastic.co/products
ElasticSearch
1.概述:
ElasticSearch是一个高可扩展的开源的全文搜索分析引擎。它允许你快速的存储、搜索和分析大量数据。ElasticSearch通常作为后端程序,为需要复杂查询的应用提供服务。
Elasticsearch是一个基于Lucene的开源分布式搜索引擎,具有分布式多用户能力。Elasticsearch是用java开发,提供Restful接口,能够达到实时搜索、高性能计算;同时Elasticsearch的横向扩展能力非常强,不需要重启服务,基本上达到了零配置。
2.解压ElasticSearch并进入目录:
unzip elasticsearch-5.1.1.zip cd elasticsearch-5.1.13.启动ElasticSearch服务:
./bin/elasticsearch因为这里使用的是root账号进行启动服务的,所以会报如下错误:
at org.elasticsearch.bootstrap.Elasticsearch.init(Elasticsearch.java:125) ~[elasticsearch-5.1.1.jar:5.1.1] at org.elasticsearch.bootstrap.Elasticsearch.execute(Elasticsearch.java:112) ~[elasticsearch-5.1.1.jar:5.1.1] at org.elasticsearch.cli.SettingCommand.execute(SettingCommand.java:54) ~[elasticsearch-5.1.1.jar:5.1.1] at org.elasticsearch.cli.Command.mainWithoutErrorHandling(Command.java:96) ~[elasticsearch-5.1.1.jar:5.1.1] at org.elasticsearch.cli.Command.main(Command.java:62) ~[elasticsearch-5.1.1.jar:5.1.1] at org.elasticsearch.bootstrap.Elasticsearch.main(Elasticsearch.java:89) ~[elasticsearch-5.1.1.jar:5.1.1] at org.elasticsearch.bootstrap.Elasticsearch.main(Elasticsearch.java:82) ~[elasticsearch-5.1.1.jar:5.1.1]Caused by: java.lang.RuntimeException: can not run elasticsearch as root at org.elasticsearch.bootstrap.Bootstrap.initializeNatives(Bootstrap.java:100) ~[elasticsearch-5.1.1.jar:5.1.1] at org.elasticsearch.bootstrap.Bootstrap.setup(Bootstrap.java:176) ~[elasticsearch-5.1.1.jar:5.1.1] at org.elasticsearch.bootstrap.Bootstrap.init(Bootstrap.java:306) ~[elasticsearch-5.1.1.jar:5.1.1] at org.elasticsearch.bootstrap.Elasticsearch.init(Elasticsearch.java:121) ~[elasticsearch-5.1.1.jar:5.1.1] ... 6 more错误很明显,不能以root账号来运行elasticsearch,网上有一种解决方法是添加es.insecure.allow.root=true参数,启动方式如下:
./bin/elasticsearch -Des.insecure.allow.root=true启动日志如下所示:
starts elasticsearch Option Description ------ ----------- -E <KeyValuePair> Configure a setting -V, --version Prints elasticsearch version information and exits -d, --daemonize Starts Elasticsearch in the background -h, --help show help -p, --pidfile <Path> Creates a pid file in the specified path on start -q, --quiet Turns off standard ouput/error streams logging in console-s, --silent show minimal output -v, --verbose show verbose output ERROR: D is not a recognized option并没有启动成功,但是试了一下在elasticsearch-2.1.1这个版本是可以成功的,官方网站的Issues也给出了说明:
In 5.0.0-alpha3, all of this has been cleaned up. The entanglement between system properties and settings has beenremoved. This means that the system property es.insecure.allow.root will not automatically be converted to a setting which means it's no longer a problem that it's not registered.更加详细的介绍https://github.com/elastic/elasticsearch/issues/18688
这是出于系统安全考虑设置的条件。由于ElasticSearch可以接收用户输入的脚本并且执行,为了系统安全考虑,建议创建一个单独的用户用来运行ElasticSearch。
4.创建用户组和用户:
groupadd esgroupuseradd esuser -g esgroup -p espassword更改elasticsearch文件夹及内部文件的所属用户及组:
cd /opt/elkchown -R esuser:esgroup elasticsearch-5.1.1切换用户并运行:
su esuser./bin/elasticsearch启动日志如下所示:
[esuser@localhost elasticsearch-5.1.1]$ ./bin/elasticsearch[2017-01-13T11:18:35,020][INFO ][o.e.n.Node ] [] initializing ...[2017-01-13T11:18:35,284][INFO ][o.e.e.NodeEnvironment ] [rBrMTNx] using [1] data paths, mounts [[/ (rootfs)]], net usable_space [21.6gb], net total_space [27.4gb], spins? [unknown], types [rootfs][2017-01-13T11:18:35,284][INFO ][o.e.e.NodeEnvironment ] [rBrMTNx] heap size [1.9gb], compressed ordinary object pointers [true][2017-01-13T11:18:35,285][INFO ][o.e.n.Node ] node name [rBrMTNx] derived from node ID [rBrMTNxCSEehQsfjvxmSgw]; set [node.name] to override[2017-01-13T11:18:35,308][INFO ][o.e.n.Node ] version[5.1.1], pid[2612], build[5395e21/2016-12-06T12:36:15.409Z], OS[Linux/3.10.0-327.el7.x86_64/amd64], JVM[Oracle Corporation/Java HotSpot(TM) 64-Bit Server VM/1.8.0_112/25.112-b15][2017-01-13T11:18:38,284][INFO ][o.e.p.PluginsService ] [rBrMTNx] loaded module [aggs-matrix-stats][2017-01-13T11:18:38,285][INFO ][o.e.p.PluginsService ] [rBrMTNx] loaded module [ingest-common][2017-01-13T11:18:38,285][INFO ][o.e.p.PluginsService ] [rBrMTNx] loaded module [lang-expression][2017-01-13T11:18:38,285][INFO ][o.e.p.PluginsService ] [rBrMTNx] loaded module [lang-groovy][2017-01-13T11:18:38,285][INFO ][o.e.p.PluginsService ] [rBrMTNx] loaded module [lang-mustache][2017-01-13T11:18:38,285][INFO ][o.e.p.PluginsService ] [rBrMTNx] loaded module [lang-painless][2017-01-13T11:18:38,285][INFO ][o.e.p.PluginsService ] [rBrMTNx] loaded module [percolator][2017-01-13T11:18:38,285][INFO ][o.e.p.PluginsService ] [rBrMTNx] loaded module [reindex][2017-01-13T11:18:38,285][INFO ][o.e.p.PluginsService ] [rBrMTNx] loaded module [transport-netty3][2017-01-13T11:18:38,285][INFO ][o.e.p.PluginsService ] [rBrMTNx] loaded module [transport-netty4][2017-01-13T11:18:38,286][INFO ][o.e.p.PluginsService ] [rBrMTNx] no plugins loaded[2017-01-13T11:18:44,427][INFO ][o.e.n.Node ] initialized[2017-01-13T11:18:44,441][INFO ][o.e.n.Node ] [rBrMTNx] starting ...[2017-01-13T11:18:44,943][INFO ][o.e.t.TransportService ] [rBrMTNx] publish_address {127.0.0.1:9300}, bound_addresses {[::1]:9300}, {127.0.0.1:9300}[2017-01-13T11:18:44,976][WARN ][o.e.b.BootstrapCheck ] [rBrMTNx] max file descriptors [4096] for elasticsearch process is too low, increase to at least [65536][2017-01-13T11:18:44,976][WARN ][o.e.b.BootstrapCheck ] [rBrMTNx] max virtual memory areas vm.max_map_count [65530] is too low, increase to at least [262144][2017-01-13T11:18:48,633][INFO ][o.e.c.s.ClusterService ] [rBrMTNx] new_master {rBrMTNx}{rBrMTNxCSEehQsfjvxmSgw}{N9FXgAA5TjC78HBimEJ9kw}{127.0.0.1}{127.0.0.1:9300}, reason: zen-disco-elected-as-master ([0] nodes joined)[2017-01-13T11:18:48,762][INFO ][o.e.g.GatewayService ] [rBrMTNx] recovered [0] indices into cluster_state[2017-01-13T11:18:48,775][INFO ][o.e.h.HttpServer ] [rBrMTNx] publish_address {127.0.0.1:9200}, bound_addresses {[::1]:9200}, {127.0.0.1:9200}[2017-01-13T11:18:48,775][INFO ][o.e.n.Node ] [rBrMTNx] started日志中启动了两个端口分别是:9300和9200,9300用于跟其他的节点的传输,9200用于接受HTTP请求,ctrl+c可以结束进程
5.后台运行:
./bin/elasticsearch -d6.简单连接:
curl 127.0.0.1:9200结果如下所示:
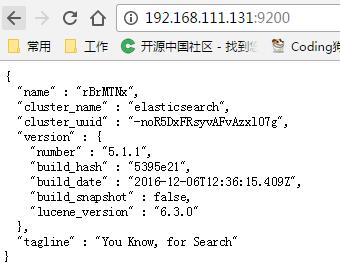
[root@localhost ~]# curl 127.0.0.1:9200{ "name" : "rBrMTNx", "cluster_name" : "elasticsearch", "cluster_uuid" : "-noR5DxFRsyvAFvAzxl07g", "version" : { "number" : "5.1.1", "build_hash" : "5395e21", "build_date" : "2016-12-06T12:36:15.409Z", "build_snapshot" : false, "lucene_version" : "6.3.0" }, "tagline" : "You Know, for Search"}7.因为elasticsearch安装在虚拟机里面,我希望我的主机也可以访问,需要对config/elasticsearch.yml进行配置:
network.host: 192.168.111.131192.168.111.131是虚拟机里面的地址,修改完之后重新启动,会出现如下错误日志:
ERROR: bootstrap checks failedmax file descriptors [4096] for elasticsearch process is too low, increase to at least [65536]max virtual memory areas vm.max_map_count [65530] is too low, increase to at least [262144]解决办法:
切换到root用户,修改配置limits.conf
vi /etc/security/limits.conf 添加如下内容:
* soft nofile 65536* hard nofile 131072* soft nproc 2048* hard nproc 4096修改配置sysctl.conf
vi /etc/sysctl.conf 添加如下内容:
vm.max_map_count=655360更加详细的参考:Elasticsearch5.0 安装问题集锦
修改完之后重启服务,并在本地浏览器中进行访问,结果如下图所示:
8.停止服务:
ps -ef |grep elasticsearchkill PID
Logstash
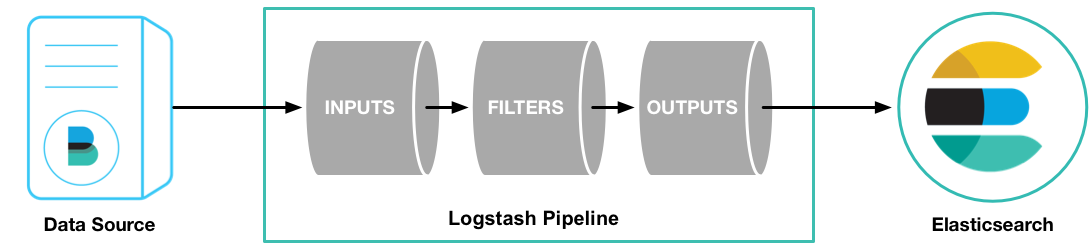
Logstash是一个完全开源的工具,可以对你的日志进行收集、过滤,并将其存储供以后使用,参考官网的介绍图:
1.解压进入目录
tar -zxvf logstash-5.1.1.tar.gzcd logstash-5.1.12.添加配置文件
vi config/first-pipeline.conf添加如下内容(项目直接向elk写日志):
input { log4j { host => "192.168.111.131" port => 8801 }}output { elasticsearch { hosts => [ "192.168.111.131:9200" ] }}或者指定日志文件路径
写法如下:
input {
file {
path => "F:\javademo\logs\elk\debug.log"
}
}
output {
elasticsearch {
hosts => "192.168.x.x"
index => "debug-%{+YYYY.MM.dd}"
}
stdout {
codec => rubydebug
}
}
3.启动服务
./bin/logstash -f config/first-pipeline.conf启动成功日志如下:
Sending Logstash's logs to /opt/elk/logstash-5.1.1/logs which is now configured via log4j2.properties[2017-01-17T11:41:42,978][INFO ][logstash.inputs.log4j ] Starting Log4j input listener {:address=>"192.168.111.131:8801"}[2017-01-17T11:41:43,565][INFO ][logstash.inputs.log4j ] Log4j input[2017-01-17T11:41:45,658][INFO ][logstash.outputs.elasticsearch] Elasticsearch pool URLs updated {:changes=>{:removed=>[], :added=>["http://192.168.111.131:9200"]}}[2017-01-17T11:41:45,659][INFO ][logstash.outputs.elasticsearch] Running health check to see if an Elasticsearch connection is working {:url=>#<URI::HTTP:0x3a685472 URL:http://192.168.111.131:9200>, :healthcheck_path=>"/"}log4j:WARN No appenders could be found for logger (org.apache.http.client.protocol.RequestAuthCache).log4j:WARN Please initialize the log4j system properly.log4j:WARN See http://logging.apache.org/log4j/1.2/faq.html#noconfig for more info.[2017-01-17T11:41:46,090][WARN ][logstash.outputs.elasticsearch] Restored connection to ES instance {:url=>#<URI::HTTP:0x3a685472 URL:http://192.168.111.131:9200>}[2017-01-17T11:41:46,115][INFO ][logstash.outputs.elasticsearch] Using mapping template from {:path=>nil}[2017-01-17T11:41:46,357][INFO ][logstash.outputs.elasticsearch] Attempting to install template {:manage_template=>{"template"=>"logstash-*", "version"=>50001, "settings"=>{"index.refresh_interval"=>"5s"}, "mappings"=>{"_default_"=>{"_all"=>{"enabled"=>true, "norms"=>false}, "dynamic_templates"=>[{"message_field"=>{"path_match"=>"message", "match_mapping_type"=>"string", "mapping"=>{"type"=>"text", "norms"=>false}}}, {"string_fields"=>{"match"=>"*", "match_mapping_type"=>"string", "mapping"=>{"type"=>"text", "norms"=>false, "fields"=>{"keyword"=>{"type"=>"keyword"}}}}}], "properties"=>{"@timestamp"=>{"type"=>"date", "include_in_all"=>false}, "@version"=>{"type"=>"keyword", "include_in_all"=>false}, "geoip"=>{"dynamic"=>true, "properties"=>{"ip"=>{"type"=>"ip"}, "location"=>{"type"=>"geo_point"}, "latitude"=>{"type"=>"half_float"}, "longitude"=>{"type"=>"half_float"}}}}}}}}[2017-01-17T11:41:46,474][INFO ][logstash.outputs.elasticsearch] New Elasticsearch output {:class=>"LogStash::Outputs::ElasticSearch", :hosts=>["192.168.111.131:9200"]}[2017-01-17T11:41:46,495][INFO ][logstash.pipeline ] Starting pipeline {"id"=>"main", "pipeline.workers"=>1, "pipeline.batch.size"=>125, "pipeline.batch.delay"=>5, "pipeline.max_inflight"=>125}[2017-01-17T11:41:46,514][INFO ][logstash.pipeline ] Pipeline main started[2017-01-17T11:41:46,935][INFO ][logstash.agent ] Successfully started Logstash API endpoint {:port=>9600}New Elasticsearch output {:class=>”LogStash::Outputs::ElasticSearch”, :hosts=>[“192.168.111.131:9200”]}表示已经成功连接了指定的Elasticsearch。
Kibana
Kibana可以为Logstash和ElasticSearch提供的日志分析友好的Web界面,可以帮助您汇总、分析和搜索重要数据日志。
1.解压进入目录
tar -zxvf kibana-5.1.1-linux-x86_64.tar.gzcd kibana-5.1.1-linux-x86_642.修改配置文件
vi config/kibana.yml添加如下配置项:
server.port: 5601server.host: "192.168.111.130"elasticsearch.url: "http://192.168.111.131:9200"kibana.index: ".kibana"3.启动服务
./bin/kibana启动成功日志如下:
log [16:42:01.349] [info][status][plugin:kibana@5.1.1] Status changed from uninitialized to green - Readylog [16:42:01.406] [info][status][plugin:elasticsearch@5.1.1] Status changed from uninitialized to yellow - Waiting for Elasticsearchlog [16:42:01.427] [info][status][plugin:console@5.1.1] Status changed from uninitialized to green - Readylog [16:42:01.567] [info][status][plugin:timelion@5.1.1] Status changed from uninitialized to green - Readylog [16:42:01.574] [info][listening] Server running at http://192.168.111.130:56014.浏览器访问
http://192.168.111.130:5601/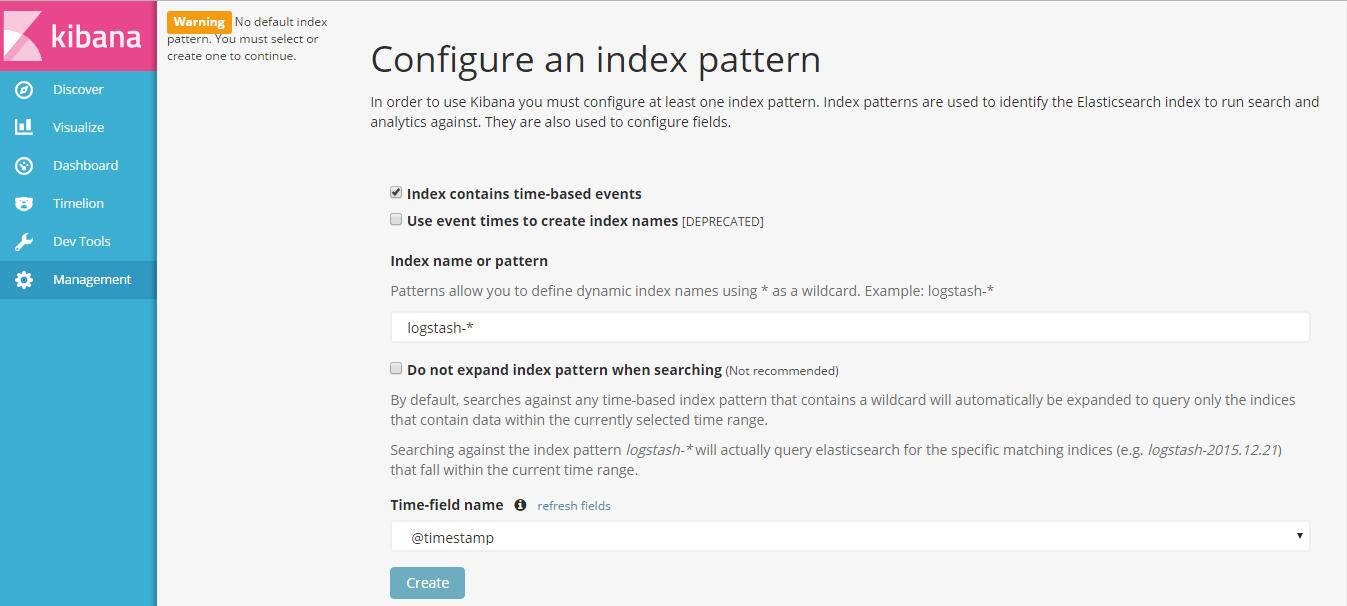
默认第一次需要Configure an index pattern,默认的Index name是logstash-*,直接create就行了(先项目执行写日志再创建,否则kibana不能创建索引)。
测试
1.准备一个测试工程,往logstash写数据,同时通过kibana查看数据
log4j maven
<dependency> <groupId>log4j</groupId> <artifactId>log4j</artifactId> <version>1.2.17</version></dependency>log4j.properties
log4j.rootLogger=DEBUG, logstash log4j.appender.logstash=org.apache.log4j.net.SocketAppenderlog4j.appender.logstash.Port=8801log4j.appender.logstash.RemoteHost=192.168.111.131log4j.appender.logstash.ReconnectionDelay=60000log4j.appender.logstash.LocationInfo=true测试类App
package com.minbo.javademo.elk;import org.apache.log4j.Logger;public class ElkLog4jTest {private static final Logger logger = Logger.getLogger(ElkLog4jTest.class);public static void main(String[] args) {logger.debug("This is a debug message of baidu!");logger.info("This is info message!");logger.warn("This is a warn message!");logger.error("This is error message!");try {System.out.println(5 / 0);} catch (Exception e) {logger.error(e);}}}运行App,会出现如下错误:
SocketException: Software caused connection abort: socket write error解决方法:
vi logstash-core/lib/logstash-core_jars.rb注释掉#require_jar( ‘org.apache.logging.log4j’, ‘log4j-1.2-api’, ‘2.6.2’ ),然后重启logstash(远程装时写未提示成功,也是因为这个没有注释掉)
2.kibana查看数据
点击Discover,然后指定好日期,就可以查看刚刚log4j发送的日志了,如下图所示:

可以指定关键字进行搜索,指定时间范围,指定刷新间隔时间等,更多的功能可以自行去摸索。
文中的项目代码地址见:我的Github地址
- ELK5.1搭建过程(ElasticSearch, Logstash, Kibana)
- 搭建elasticsearch+logstash+kibana
- 从头搭建Logstash+ElasticSearch+Kibana
- Elasticsearch, Logstash, Kibana (ELK) 搭建
- Elasticsearch+Kibana+Logstash 搭建日志平台
- logstash+elasticsearch+kibana快速搭建日志平台
- logstash+elasticsearch+kibana快速搭建日志平台
- logstash+elasticsearch+kibana快速搭建日志平台
- logstash elasticsearch kibana搭建日志平台
- Elasticsearch&logstash&filebeat&kibana&x-pack搭建
- ELK(ElasticSearch, Logstash, Kibana)搭建日志分析平台-Kibana篇
- ELK(ElasticSearch, Logstash, Kibana)搭建日志分析平台-Logstash篇
- ELK(ElasticSearch, Logstash, Kibana)搭建日志分析平台-Elasticsearch篇
- elasticsearch+logstash+kibana 初探
- Elasticsearch+Logstash+Kibana配置
- elasticsearch+logstash+kibana+marvel
- ELK-ElasticSearch+Logstash+Kibana
- 使用logstash+elasticsearch+kibana快速搭建日志平台
- [原创]Allegro 导入DXF文件,保留布好的线路信息
- c++ 堆、栈、自由存储区、全局/静态存储区和常量存储区
- 双模蓝牙CC2564调试笔记
- Android TextView文字底部或者中间 加横线
- 什么是SPI通信
- ELK5.1搭建过程(ElasticSearch, Logstash, Kibana)
- 【公式+矩阵快速幂】HDU_3117 Fibonacci Numbers
- CSDN日报20170615 ——《11 年高考结束到 17 年日本修士的心路历程》
- 关于时钟线/数据线/地址线上串联电阻及其作用
- [原创]Keil uVision4 安装破解
- NandFlash和NorFlash的区别
- 企业级前端应用开发平台:EDP、edp webserver、EDP Build
- 过冲、振铃,非单调性
- [原创]DC-DC输出端加电压会烧毁