HTML Vertical Bar Chart
来源:互联网 发布:免费网络暴力赚钱项目 编辑:程序博客网 时间:2024/06/08 04:21
HTML Vertical Bar Chart
By Neeraj Saluja- Download demo project - 3.7 Kb
- Download HTML Vertical Chart with ASP.NET 1.1 demo project - 20.4 Kb
Introduction
Recently, I came across a requirement of displaying colorful barcharts in our web application. Since I am using ASP.NET 1.1, a lot ofwonderful ideas came to me, such as using MS Office web officecomponents, using third party controls to generate charts, finding somegreat ways of using System.Drawing things to displaycharts, etc. One of the approaches that struck me was using just plainHTML, a bit of DHTML and JavaScript to do the same thing. At firstglance, it could seem to be a horrifying idea, but working with basicsto achieving big requirements is never bad. Let me keep it very shortand simple and see how this can be achieved.
Inside look at the script
Here we are going to look at the single and double vertical bar charts, which look somewhat like this:
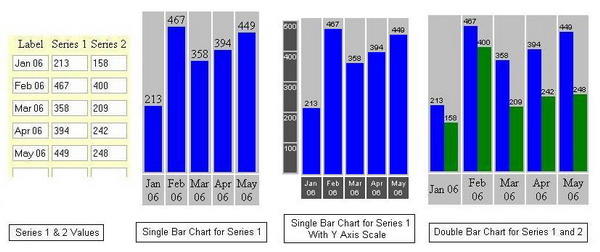
Single vertical bar chart
Let me explain in a very simple way how this colorful chart is generated. This bar chart is generated using an HTML table and <DIV>s. It is basically a set of <DIV>s smartly placed inside the <TD>s of HTML table <TR>s. This chart table needs only two rows: one to contain <DIV>s that represent values and another one to show X-axis labels. Let us cook this chart up step by step.
- Take an HTML table.
- Determine how many columns you need in the table by determining thenumber of items you want to have on the chart. Let us say you got
colNumas the number of columns you need. In the example attached, it is 24. - Take two rows in that table.
- In the first row, add the
colNumnumber of<TD>s having<DIV>s with appropriate width and height. - In the second row, add the
colNumnumber of<TD>s having<DIV>s with labels for the X-axis.
This generates the skeleton for your chart. Now to represent the values on the chart, we need to place <DIV>s inside each <TD> of the first row (Step 4) , with the appropriate height and width. Say tdwd is the width of each bar and h is the height that you would need for this bar. Then it would be:
<TD>
    <div style='background-color:blue; width:" + (tdwd-5) +
        "; height:" + h + ";' />
</TD>
Each of us can have our own logic for determining the tdwd and h. For instance, if we have a fixed area for the chart then we can determine the tdwd by dividing the chart width by number of columns we want. The one that is used here is:
tdwd = parseInt((chartwidth-(HorX.length*4))/HorX.length);
h = parseInt(VerY[i] / (vmax / 200));
Have a look at the attached code to understand it completely.
Double vertical bar chart
Now it won't be too hard to understand how to generate a double bar chart. In the same <TD> of Step 4, rather than adding one <DIV> we need to place two <DIV>s. The height of the second <DIV>should be guided by the second array of information. That's it. Tobetter format the stuff, you can actually add another table inside the <TD> with one row and two columns, each column having a <DIV> representing the value. Let us see how the HTML code would look:
<TD>
    <table cellpadding=0 cellspacing=0 border=0
        width=" + (tdwd*2/3) + ">
        <tr>
            <td align=center valign=bottom width=50%>
                <font face=arial size='-2'> + VerY[i] +
                </font>
                <div style='background-color:blue; height:" + h +
                    "px; writing-mode:tb-rl;'></div>
             </td>
             <td align=center valign=bottom width=50%>
                 <font face=arial size='-2'> + VerY2[i] + </font>
                 <div style='background-color:green; height:" + h2 +
                     "px; writing-mode:tb-rl;'></div>
             </td>
         </tr>
     </table>
</TD>
Here, h2 = parseInt(VerY2[i] / (vmax / 200)); can be used to determine the height of the second <DIV> and <font face=arial size='-2'> + VerY[i] + </font> writes the value of the bar above the bar.
Printing the charts
There is an Internet Explorer setting that determines whether or not to allow printing of the background color of <DIV>sand background Images. By default, IE settings do not allow theprinting of background colors. To change this setting in IE 6, go tothe Tools menu of IE -> Select "Internet Options..." -> Selectthe "Advanced" tab. Now scroll down to the "Printing" section and checkthe checkbox for "Print Background Color and Images." We must have theequivalent for them in IE 7 and other good browsers.
IE stores and picks this information from the registry. So, if youwant to enable the printing of background colors and images with thescript, add the following code in the HTML part of the landing page:
<script language="vbscript">
    on error resume next
    'Change IE Print Settings to
    'Print Background Color and Images
    Set WSHShell = CreateObject("WScript.Shell")
    WSHShell.RegWrite "HKCU/Software/Microsoft/" +
    "Internet Explorer/Main/Print_Background", "yes"
    Set WSHShell = Nothing
</script>
Benefits
Charts developed in such ways using basic HTML can be used veryeffectively by clubbing them with web development tools and technologylike ASP, ASP.NET, JSP, etc. All that's needed is an array of values tobe displayed in the graphical manner. This works with Netscape as well,so scope is further increased automatically.
Version history
Version 1.1
Fixed issue in demo: Chart not getting displayed in Netscape browser when user selects "Show Chart in same Window."Version 1.2
Feature included: Y-axis scale can now be displayed, guided by usersettings. Presently, the following settings are made in the demo, whichwould display the Y-axis scale as shown in the 3rd chart in the figureabove:
var chartHeight = 500;
var chartYAxisInterval = 100;
var displayYAxisScale = true;
Version 1.3
Added demo: Added a sample demo to show how HTML vertical bar chartscan be generated very easily in ASP.NET, with DataTable being the datasource. The complete solution can be downloaded here. Key notes for Version 1.3: ASP.NET Version 1.1 is used in the demo and can be used in similar ways with ASP.NET 2.0.
The texts of the X-axis labels are now displayed in the vertical wayto avoid issues with the alignments when the X-axis label text is toolong. This works fine with IE 6, SP 2 on the Windows XP platform andalso with Netscape 8.04 if the options configured properly. To makethis work in Netscape 8.04, set the rendering engine to IE by going toMenu -> Tools-> Options-> Site Controls -> Site List Tab.The writing-mode property is presently supported by IE only. With thissetting done, when Netscape comes across any property which it does notsupport, it goes to the IE rendering engine and checks whether it issupported by IE. If IE supports it, Netscape uses its feature andrenders it as per the IE rendering engine.
For User convenience, the HTML demo contains the script with X-axishorizontal text. The ASP.NET demo contains the script with X-axisvertical text.
Version 1.4
Included support for X-axis and Y-axis labels on demand in the basedemo. Also, limited the number of columns in the demo from 24 to 12 forbetter understanding of it.
Conclusion
Basic building blocks of HTML/DHTML with coating can create wonderswhen used smartly. User experience is best guided by UI. This is justone of the HTML charts that I am putting across; there are more tocome. If interested, click here to view all my published articles.
History
- 5 October, 2006 -- Original version posted
- 2 January, 2007 -- Article moved
- 19 March, 2007 -- Updated
- 3 July, 2007 -- Updated
License
Thisarticle has no explicit license attached to it but may contain usageterms in the article text or the download files themselves. If in doubtplease contact the author via the discussion board below.
A list of licenses authors might use can be found here
About the Author
Neeraj Saluja
.NET Professional, working with a leading global firm.
Primarily works in .NET using C# with Oracle and MS SQL Server 2000 as backend.
Learning .Net ...
[ My Linked In Profile ^ ][ MicrosoftTalks ^ ]
Occupation: Web DeveloperLocation:
From: http://www.codeproject.com/KB/HTML/HTMLVerticalBarChart.aspx
- HTML Vertical Bar Chart
- Bar Chart 学习例子
- height chart bar can draggable.
- Chart FX for jAVA(1)---bar
- Raphaël 编写的Bar Chart
- EXTJS Stacked Bar Chart堆叠条形图
- [Elasticsearch] 聚合 - 创建条形图(Bar Chart)
- jQuery flot stacked bar chart example
- Kibana User Guide [4.2] » Visualize » Vertical Bar Charts
- menu bar (html+css)
- Chart FX for JAVA (2)--------Lines AND Bar
- Draw Line and Bar Chart with Matplotlib 画线和图表
- Android Canvas练习(3)自已绘柱形图(Bar Chart)
- 条形图打印程序(Bar Chart Printing Program)
- java中用printf()方法来生成bar chart
- Customizing chart bar color. Make the bar can filld with picture.
- Markdown编辑表格时如何输入竖线('|', pipe,vertical bar)
- Markdown编辑表格时如何输入竖线('|', pipe,vertical bar)
- Printing with Style
- Log的使用
- “希望”是我们最重要的策略——项目经理应该小心的游戏之二
- 【编程游戏】贺岁放礼花。(点燃续帖1-18楼Free_Wind22的焰火)
- Lighttpd phpcgi mysql DEB包的安装
- HTML Vertical Bar Chart
- 视频转换的方法介绍
- 百度新闻机制
- 添加期刊文章时,里面的类型及类型的解决方案
- VB6对任意数据库的通用操作方法
- DMenu, DHTML Menu
- PDM/PLM系统授权模型的研究和应用 【转自:ZDNet 企业管理软件频道】
- 中外企业白领自曝“裁员秘史”
- Ten ways to speed up the download time of your web pages