.net使用DotNetCharting控件生成报表统计图总结
来源:互联网 发布:linux 怎样回到根目录 编辑:程序博客网 时间:2024/05/08 11:56
最近在做项目时要对数据进行统计分析,所以必须生成一些报表统计图(如柱形图、饼图、曲线图等),网上强烈推荐了使用DotNetCharting控件来实现,于是自己对DotNetCharting控件进行了简单的学习,下面先简单介绍一下DotNetCharting控件及其使用。

 using System;
using System.Data;
using System.Text;
using dotnetCHARTING;
namespace FLX.ComplexQuery
{
 /// <summary>
 /// 彭建军
/// 根据数据动态生成图形(柱形图、饼图、曲线图)
/// 2008-06-19
 /// </summary>
public class ShowData
{
#region 属性
private string _phaysicalimagepath;//图片存放路径
private string _title; //图片标题
private string _xtitle;//图片x座标名称
private string _ytitle;//图片y座标名称
private string _seriesname;//图例名称
private int _picwidth;//图片宽度
private int _pichight;//图片高度
private DataTable _dt;//图片数据源
/// <summary>
/// 图片存放路径
/// </summary>
public string PhaysicalImagePath
{
set{_phaysicalimagepath=value;}
get{return _phaysicalimagepath;}
}
/// <summary>
/// 图片标题
/// </summary>
public string Title
{
set{_title=value;}
get{return _title;}
}
/// <summary>
/// 图片标题
/// </summary>
public string XTitle
{
set{_xtitle=value;}
get{return _xtitle;}
}
/// <summary>
/// 图片标题
/// </summary>
public string YTitle
{
set{_ytitle=value;}
get{return _ytitle;}
}
/// <summary>
/// 图例名称
/// </summary>
public string SeriesName
{
set{_seriesname=value;}
get{return _seriesname;}
}
/// <summary>
/// 图片宽度
/// </summary>
public int PicWidth
{
set{_picwidth=value;}
get{return _picwidth;}
}
/// <summary>
/// 图片高度
/// </summary>
public int PicHight
{
set{_pichight=value;}
get{return _pichight;}
}
/// <summary>
/// 图片数据源
/// </summary>
public DataTable DataSource
{
set{_dt=value; }
get{return _dt;}
}
#endregion
#region 构造函数
public ShowData()
{
//
// TODO: 在此处添加构造函数逻辑
//
}
public ShowData(string PhaysicalImagePath,string Title,string XTitle,string YTitle,string SeriesName)
{
_phaysicalimagepath=PhaysicalImagePath;
_title=Title;
_xtitle=XTitle;
_ytitle=YTitle;
_seriesname=SeriesName;
}
#endregion
#region 输出柱形图
/// <summary>
/// 柱形图
/// </summary>
/// <returns></returns>
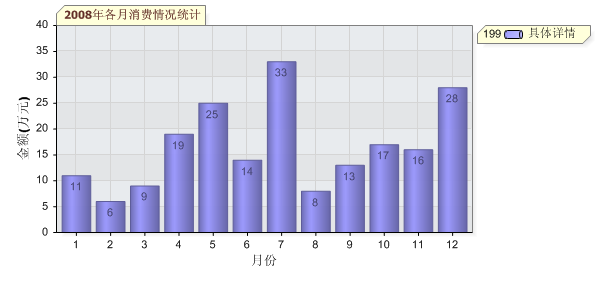
public void CreateColumn(dotnetCHARTING.Chart chart)
{
chart.Title=this._title;
chart.XAxis.Label.Text=this._xtitle;
chart.YAxis.Label.Text=this._ytitle;
chart.TempDirectory =this._phaysicalimagepath;
chart.Width = this._picwidth;
chart.Height = this._pichight;
chart.Type = ChartType.Combo ;
chart.Series.Type =SeriesType.Cylinder;
chart.Series.Name = this._seriesname;
chart.Series.Data = this._dt;
chart.SeriesCollection.Add();
chart.DefaultSeries.DefaultElement.ShowValue = true;
chart.ShadingEffect = true;
chart.Use3D = false;
chart.Series.DefaultElement.ShowValue =true;
}
#endregion
#region 输出饼图
/// <summary>
/// 饼图
/// </summary>
/// <returns></returns>
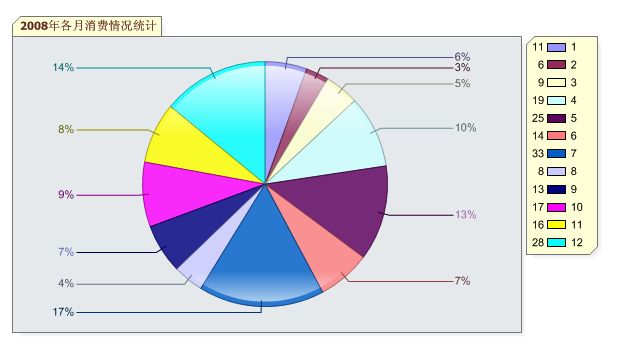
public void CreatePie(dotnetCHARTING.Chart chart)
{
chart.Title=this._title;
chart.TempDirectory =this._phaysicalimagepath;
chart.Width = this._picwidth;
chart.Height = this._pichight;
chart.Type = ChartType.Pie;
chart.Series.Type =SeriesType.Cylinder;
chart.Series.Name = this._seriesname;
chart.ShadingEffect = true;
chart.Use3D = false;
chart.DefaultSeries.DefaultElement.Transparency = 20;
chart.DefaultSeries.DefaultElement.ShowValue = true;
chart.PieLabelMode = PieLabelMode.Outside;
chart.SeriesCollection.Add(getArrayData());
chart.Series.DefaultElement.ShowValue = true;
}
private SeriesCollection getArrayData()
{
SeriesCollection SC = new SeriesCollection();
DataTable dt = this._dt;
for(int i=0; i < dt.Rows.Count; i++)
{
Series s = new Series();
s.Name = dt.Rows[i][0].ToString();
Element e = new Element();
// 每元素的名称
e.Name = dt.Rows[i][0].ToString();
// 每元素的大小数值
e.YValue=Convert.ToInt32(dt.Rows[i][1].ToString());
s.Elements.Add(e);
SC.Add(s);
}
return SC;
}
#endregion
#region 输出曲线图
/// <summary>
/// 曲线图
/// </summary>
/// <returns></returns>
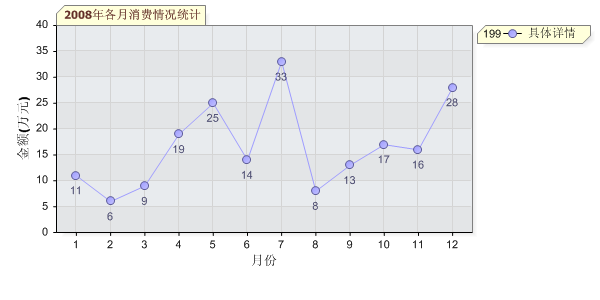
public void CreateLine(dotnetCHARTING.Chart chart)
{
chart.Title=this._title;
chart.XAxis.Label.Text=this._xtitle;
chart.YAxis.Label.Text=this._ytitle;
chart.TempDirectory =this._phaysicalimagepath;
chart.Width = this._picwidth;
chart.Height = this._pichight;
chart.Type = ChartType.Combo ;
chart.Series.Type =SeriesType.Line;
chart.Series.Name = this._seriesname;
chart.Series.Data = this._dt;
chart.SeriesCollection.Add();
chart.DefaultSeries.DefaultElement.ShowValue = true;
chart.ShadingEffect = true;
chart.Use3D = false;
chart.Series.DefaultElement.ShowValue =true;
}
#endregion
#region 调用说明及范例
// 在要显示统计图的页面代码直接调用,方法类似如下:
//
// ShowData show=new ShowData();
// show.Title ="2008年各月消费情况统计";
// show.XTitle ="月份";
// show.YTitle ="金额(万元)";
// show.PicHight =300;
// show.PicWidth =600;
// show.SeriesName ="具体详情";
// show.PhaysicalImagePath ="ChartImages";
// show.DataSource =this.GetDataSource();
// show.CreateColumn(this.Chart1);
#endregion
}
 }
}
效果图展示:
1、饼图
2、柱形图
3、曲线图
补充:
帖子发了一天,没人回答我多维统计图的实现方式,只好自己去dotnetcharting的官方网站下载了最新的dotnetcharting控件,在dotnetcharting控件的使用说明文档中详细地介绍了各种多维统计图的实现方式。现把说明文档贴出来供大家下载
dotnetcharting使用说明文档
追加补充新内容:
1、解决“每运行一次DotNetCharting页面,就会生成一个图片,这样图片不是越来越多吗?请问怎样自动删除DotNetCharting生成的图片呢”的问题,参照asp.net删除文件夹里的所有文件 。
2、解决“(1)生成的图片带超链接导向官网,如何处理呀?(2)我使用这个控件后,图形可以显示出来。但是发现一个小问题。就是在图形的左上方和图形的下面都隐含了超链接,鼠标移动到这两个区域后,点击都会链接到http://www.dotnetcharting.com/。很奇怪,这是和破解有管吗?”等类似的问题,参照DotnetCharting控件各版本破解方法 。
DotNetCharting是一个非常棒的.NET图表控件,对中文支持非常好,而且操作方便,开发快速,既有for webform 也有forwinform的,而且.net1.1和2.0都有支持。它的官方地址是http://www.dotnetcharting.com/
本站也提供了DotNetCharting破解版本下载: http://files.cnblogs.com/dreamof/dotnetcharting.rar
强烈推荐一下DotNetCharting的demo地址:
这个是所有的 DEMO 演示 http://www.dotnetcharting.com/demo.aspx
这个是 Online Documentation http://www.dotnetcharting.com/documentation/v4_4/webframe.html 里面会有详细的说明和用法。
DotNetCharting的简单使用方法:
1.把/bin/dotnetCHARTING.dll添加到工具箱,并且添加引用;
2.把控件拖到你的网页上,然后添加引用using dotnetCHARTING;就可以用了;
3.接下来是自己写的对DotNetCharting操作的封装类,以便于在程序里调用。
using System;using System.Data;using System.Text;using dotnetCHARTING;namespace FLX.ComplexQuery{
 /// <summary>
  /// 彭建军 /// 根据数据动态生成图形(柱形图、饼图、曲线图) /// 2008-06-19 /// </summary> public class ShowData { #region 属性 private string _phaysicalimagepath;//图片存放路径 private string _title; //图片标题 private string _xtitle;//图片x座标名称 private string _ytitle;//图片y座标名称 private string _seriesname;//图例名称 private int _picwidth;//图片宽度 private int _pichight;//图片高度 private DataTable _dt;//图片数据源 /// <summary> /// 图片存放路径 /// </summary> public string PhaysicalImagePath { set{_phaysicalimagepath=value;} get{return _phaysicalimagepath;} } /// <summary> /// 图片标题 /// </summary> public string Title { set{_title=value;} get{return _title;} } /// <summary> /// 图片标题 /// </summary> public string XTitle { set{_xtitle=value;} get{return _xtitle;} } /// <summary> /// 图片标题 /// </summary> public string YTitle { set{_ytitle=value;} get{return _ytitle;} } /// <summary> /// 图例名称 /// </summary> public string SeriesName { set{_seriesname=value;} get{return _seriesname;} } /// <summary> /// 图片宽度 /// </summary> public int PicWidth { set{_picwidth=value;} get{return _picwidth;} } /// <summary> /// 图片高度 /// </summary> public int PicHight { set{_pichight=value;} get{return _pichight;} } /// <summary> /// 图片数据源 /// </summary> public DataTable DataSource { set{_dt=value; } get{return _dt;} } #endregion #region 构造函数 public ShowData() { // // TODO: 在此处添加构造函数逻辑 // } public ShowData(string PhaysicalImagePath,string Title,string XTitle,string YTitle,string SeriesName) { _phaysicalimagepath=PhaysicalImagePath; _title=Title; _xtitle=XTitle; _ytitle=YTitle; _seriesname=SeriesName; } #endregion #region 输出柱形图 /// <summary> /// 柱形图 /// </summary> /// <returns></returns> public void CreateColumn(dotnetCHARTING.Chart chart) { chart.Title=this._title; chart.XAxis.Label.Text=this._xtitle; chart.YAxis.Label.Text=this._ytitle; chart.TempDirectory =this._phaysicalimagepath; chart.Width = this._picwidth; chart.Height = this._pichight; chart.Type = ChartType.Combo ; chart.Series.Type =SeriesType.Cylinder; chart.Series.Name = this._seriesname; chart.Series.Data = this._dt; chart.SeriesCollection.Add(); chart.DefaultSeries.DefaultElement.ShowValue = true; chart.ShadingEffect = true; chart.Use3D = false; chart.Series.DefaultElement.ShowValue =true; } #endregion #region 输出饼图 /// <summary> /// 饼图 /// </summary> /// <returns></returns> public void CreatePie(dotnetCHARTING.Chart chart) { chart.Title=this._title; chart.TempDirectory =this._phaysicalimagepath; chart.Width = this._picwidth; chart.Height = this._pichight; chart.Type = ChartType.Pie; chart.Series.Type =SeriesType.Cylinder; chart.Series.Name = this._seriesname; chart.ShadingEffect = true; chart.Use3D = false; chart.DefaultSeries.DefaultElement.Transparency = 20; chart.DefaultSeries.DefaultElement.ShowValue = true; chart.PieLabelMode = PieLabelMode.Outside; chart.SeriesCollection.Add(getArrayData()); chart.Series.DefaultElement.ShowValue = true; } private SeriesCollection getArrayData() { SeriesCollection SC = new SeriesCollection(); DataTable dt = this._dt; for(int i=0; i < dt.Rows.Count; i++) { Series s = new Series(); s.Name = dt.Rows[i][0].ToString(); Element e = new Element(); // 每元素的名称 e.Name = dt.Rows[i][0].ToString(); // 每元素的大小数值 e.YValue=Convert.ToInt32(dt.Rows[i][1].ToString()); s.Elements.Add(e); SC.Add(s); } return SC; } #endregion #region 输出曲线图 /// <summary> /// 曲线图 /// </summary> /// <returns></returns> public void CreateLine(dotnetCHARTING.Chart chart) { chart.Title=this._title; chart.XAxis.Label.Text=this._xtitle; chart.YAxis.Label.Text=this._ytitle; chart.TempDirectory =this._phaysicalimagepath; chart.Width = this._picwidth; chart.Height = this._pichight; chart.Type = ChartType.Combo ; chart.Series.Type =SeriesType.Line; chart.Series.Name = this._seriesname; chart.Series.Data = this._dt; chart.SeriesCollection.Add(); chart.DefaultSeries.DefaultElement.ShowValue = true; chart.ShadingEffect = true; chart.Use3D = false; chart.Series.DefaultElement.ShowValue =true; } #endregion #region 调用说明及范例 // 在要显示统计图的页面代码直接调用,方法类似如下: //// ShowData show=new ShowData(); // show.Title ="2008年各月消费情况统计";// show.XTitle ="月份";// show.YTitle ="金额(万元)";// show.PicHight =300;// show.PicWidth =600;// show.SeriesName ="具体详情";// show.PhaysicalImagePath ="ChartImages";// show.DataSource =this.GetDataSource();// show.CreateColumn(this.Chart1); #endregion }}
效果图展示:
1、饼图
2、柱形图
3、曲线图
补充:
帖子发了一天,没人回答我多维统计图的实现方式,只好自己去dotnetcharting的官方网站下载了最新的dotnetcharting控件,在dotnetcharting控件的使用说明文档中详细地介绍了各种多维统计图的实现方式。现把说明文档贴出来供大家下载
dotnetcharting使用说明文档
追加补充新内容:
1、解决“每运行一次DotNetCharting页面,就会生成一个图片,这样图片不是越来越多吗?请问怎样自动删除DotNetCharting生成的图片呢”的问题,参照asp.net删除文件夹里的所有文件 。
2、解决“(1)生成的图片带超链接导向官网,如何处理呀?(2)我使用这个控件后,图形可以显示出来。但是发现一个小问题。就是在图形的左上方和图形的下面都隐含了超链接,鼠标移动到这两个区域后,点击都会链接到http://www.dotnetcharting.com/。很奇怪,这是和破解有管吗?”等类似的问题,参照DotnetCharting控件各版本破解方法 。
- .net使用DotNetCharting控件生成报表统计图总结
- .net使用DotNetCharting控件生成报表统计图总结
- .NET使用DotNetCharting控件生成报表统计图总结
- 转载--.net使用DotNetCharting控件生成报表统计图总结
- net使用DotNetCharting控件生成报表统计图总结
- .net使用DotNetCharting控件生成报表统计图总结
- .net使用DotNetCharting控件生成报表统计图总结
- .net使用DotNetCharting控件生成报表统计图总结
- net使用DotNetCharting控件生成报表统计图
- asp.net使用DotNetCharting控件生成报表统计图
- C#.net使用DotNetCharting控件生成报表统计图--A
- 使用DotNetCharting控件生成报表统计图
- .net使用DotNetCharting控件生成报表统计图总结 (http://www.cnblogs.com/dreamof/archive/2008/07/18/1245887.html)
- 在.net使用DotNetCharting控件生成报表统计图总结 文章中,不少朋友提出“每运行一次DotNetCharting页面,就会生成一个图片,这样图片不是越来越多吗?请问怎样自动删除DotNetCharting生成的图片呢”的问题,于是自己对as
- 统计图控件dotnetCharting和ZedGraph比较
- 统计图控件dotnetCharting和ZedGraph比较
- 告别.NET生成报表统计图的烦恼
- 告别.NET生成报表统计图的烦恼
- 开篇随笔
- AjaxPro在.NET中的应用
- DbUtils入门实例
- 北京:2009年春运火车票购买指南
- 电平与分贝
- .net使用DotNetCharting控件生成报表统计图总结
- 突然又迷失了
- Wall-E
- VS2005中 GRIDVIEW的使用细节
- Common Dbutils组件用法详解(含源代码)
- CIO:未来发展趋势要纳入业务流程管理
- .Net 操作XML文件!!
- 多字节字符串与宽字符串的转换
- 无法在Web服务器上启动调试