matlab三维立体图
来源:互联网 发布:纳什生涯数据 编辑:程序博客网 时间:2024/04/29 05:57
前言:在地球物理勘探,流体空间分布等多种场景中,定位空间点P(x,y,x)的物理属性值Q,并绘制三维空间分布图,对我们洞察空间场景有十分重要的意义。
1. 三维立体图的基本要件:
- 全空间网格化
- 网格节点的物理属性值
2.数据准备
数据不易贴,我放在了百度网盘:点击下载数据
大概如下形式:

TIP:
这里的数据矩阵为v(5276),可以看成一本27页纸,每页绘制了5*6的网格,然后27页纸叠在一起。当你理解本图绘制后,数据可以随意制作。
3.主要函数:slice、isosurface、patch
NOTE:想了解每个函数的用法可以在matlab command windows中 输入 doc slice即可获得slice的matlab详解
4.主要代码:
TIP:你可以将代码复制到一起运行,此处我是单独展示,分别绘图
1.单独切片,切法可自定义。便于展示局部细节
clc,clearv=csvread('vdata.txt');v=reshape(v,5,27,6);[x,y,z]=meshgrid(1:27,1:5,1:6);h=figure(1);set(h,'name','取单切片')subplot(221)slice(x,y,z,v,[],[1],[]);shading interp set(gca,'zdir','reverse');axis equalgrid onsubplot(222)slice(x,y,z,v,[],[2],[]);shading interp colormap('jet')set(gca,'zdir','reverse');axis equalgrid onsubplot(223)slice(x,y,z,v,[],[3],[]);shading interp set(gca,'zdir','reverse');axis equalgrid onsubplot(224)slice(x,y,z,v,[],[4],[]);shading interp set(gca,'zdir','reverse');axis equalgrid on效果图:

2.全空间立体切片
h2=figure(2);set(h2,'name','全空间切片','MenuBar','none','ToolBar','none')slice(x,y,z,v,[1:2:27],[2 3 4],[2 3 4 5])shading interp colorbar colormap('jet')set(gca,'zdir','reverse');axis equalgrid onbox on效果图:

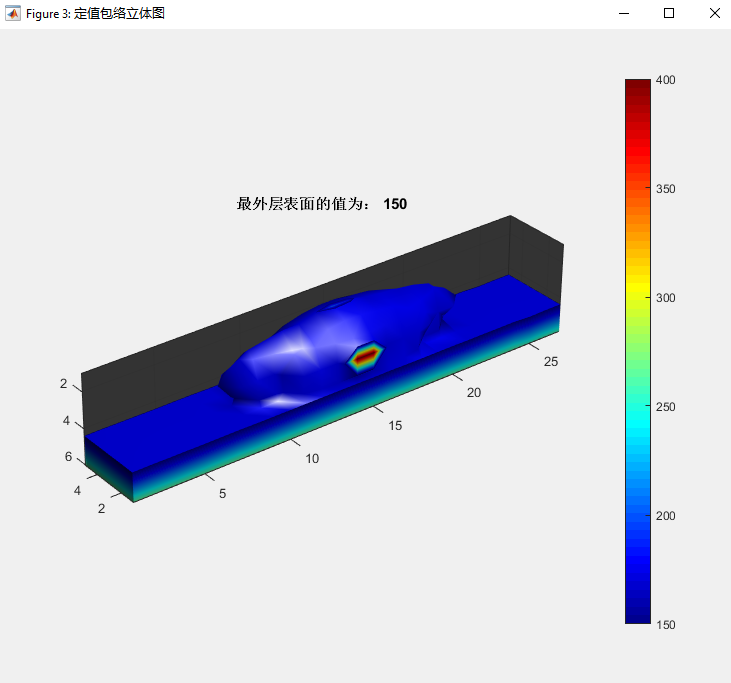
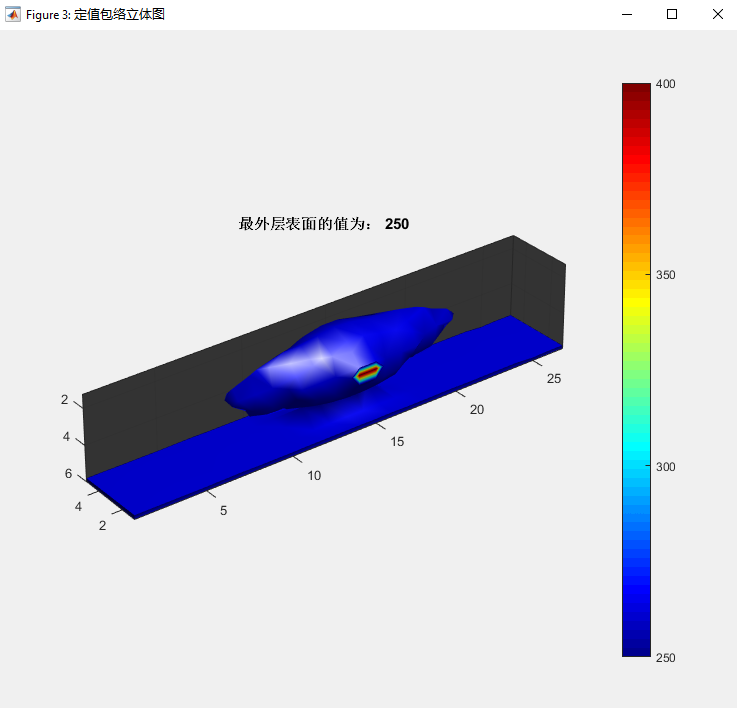
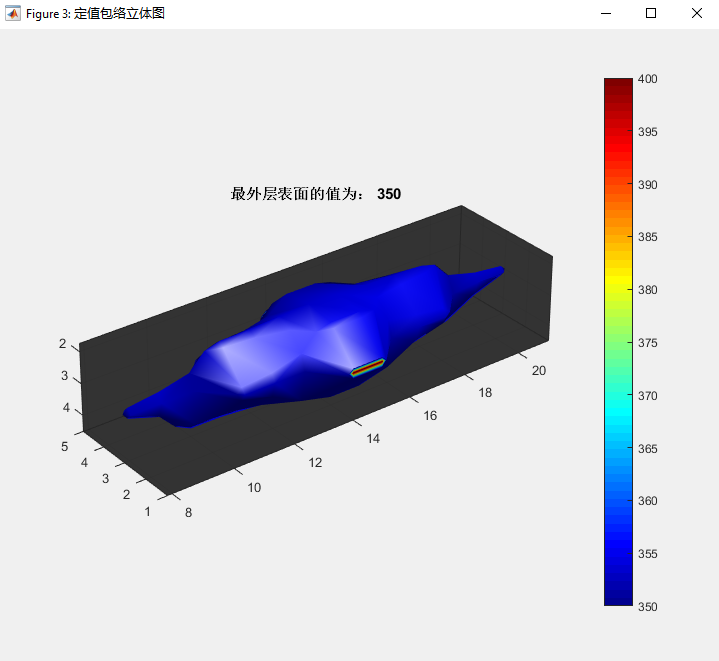
3.立体包络图
h3=figure(3);set(h3,'name','定值包络立体图','MenuBar','none','ToolBar','none')set(gcf,'InvertHardcopy','off')fw=350; %%此值为最外层包络面取值fv=isosurface(x,y,z,v,fw);p=patch(fv);set(p,'facecolor','b','edgecolor','none');patch(isocaps(x,y,z,v, fw), 'FaceColor', 'interp', 'EdgeColor', 'none');colorbarcolormap('jet')box ondaspect([1,1,1])view(3)set(gca,'zdir','reverse','color',[0.2,0.2,0.2]);camlightcamproj perspectivelighting phongaxis equalgrid ontitle(['最外层表面的值为: ' , num2str(fw)]);NOTE:上述代码中的fw是作主要可变参数,控制最外层包络面的值
如下演示多个fw下不同的效果图:
csdn博客与此同步,欢迎转载,注明出处。有任何问题和建议,欢迎留言讨论,也可以发我邮箱wenbya@foxmail.com
阅读全文
0 0
- matlab三维立体图
- Matlab中二维统计分析图和三维立体图
- Matlab中二维统计分析图和三维立体图
- Matlab slice方法和包络法绘制三维立体图
- FusionChart三维立体图
- 奇妙的三维立体图
- Matlab 绘制三维立体图(以地质异常体为例)
- Matlab 绘制三维立体图(以地质异常体为例)
- 立体图与三维数据展示
- matlab绘制立体图
- matlab绘制立体图
- FusionChart三维立体图之折线图
- 三维立体图的原理和欣赏方法
- 三维立体图,谁能看出来图中是什么
- 立体图
- 立体图
- Matlab数据的可视化 -- 柱形立体图
- 新手上路,matlab基础(4)绘制立体图
- 数据结构 (一)绪论
- 学习swift《创建简单的控件》
- Codeforces Round #427 (Div. 2) A. Key races
- PHP中如何读出文件内容
- MAC电脑使用XAMPP和Cornerstone(等同于Windows版的TortoiseSVN)对接svn服务器
- matlab三维立体图
- 在 linux 下使用 CMake 构建应用程序
- 去掉Nav 底部横线
- ios-核心动画
- Certificate Pinning in Android
- poj2785----折半枚举
- 不负责任的服务端接口开发
- Java源码阅读-Vector
- Linux的Locale