Create and format Word documents using R software and Reporters package
来源:互联网 发布:成功瘦下来 知乎 编辑:程序博客网 时间:2024/06/02 05:43
- Home
- Explorer
- Home
- Easy Guides
- R software
- Import and export data using R
- Exporting Data From R
- Create and format Word documents using R software and Reporters package
Create and format Word documents using R software and Reporters package
- Discussion (1)
- Install and load the ReporteRs R package
- Create a simple Word document
- Add texts : title and paragraphs of texts
- Format the text of a Word document using R software
- Text properties : font, color, size
- Change the global font size and font family
- Change the appearance of a “Piece Of Text” (pot)
- Add plots and images
- Add a table
- Add a simple table
- Add a zebra striped table
- Add lists : ordered and unordered lists
- Add simple lists
- Add multi-level lists
- Add a footnote to a Word document
- Add R scripts
- Add a table of contents into a Word document
- Infos
Word document is one of the file formats widely used by many people, including researchers, for editing their text and tracking changes between different authors.
There are different solutions to generate a Word document from R software :
- R2wd package : unfortunately it depends on statconnDCOM or RDCOMClient servers, and works on Windows only.
- knitr + rmarkdown + pandoc : this is an easy way to quickly create a Word report but the output is very basic.
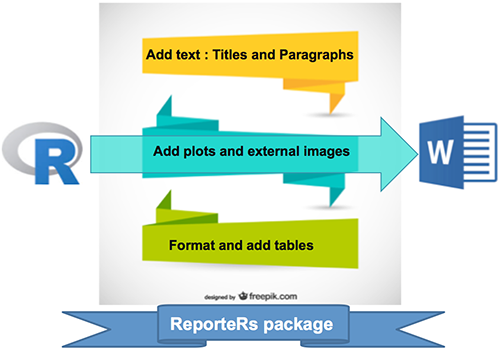
- ReporteRs package, by David Gohel, provides easy to use functions to write and format Word documents. It can be also used to generate Word document from a template file with logos, fonts, etc. ReporteRs is Java-based solution, so it works on Windows, Linux and Mac OS systems.
The aim of this R tutorial is to show you how to easily and quickly export outputs (including data table, plots, paragraphs of text and R scripts) from R statistical software to a Microsoft Word document (.docx file format) using ReporteRs package.
Install and load the ReporteRs R package
ReporteRs can be installed and loaded as follow :
install.packages('ReporteRs') # Installlibrary('ReporteRs') # LoadThe version of Java installed on your computer, can be checked with this R code :
system("java -version")Create a simple Word document
Word document can be created using the docx() function. Then, contents can be added to the document using the functions below:
- addTitle: Add a title
- addParagraph: Add paragraphs of text
- addFlexTable: Add a table
- addPlot: Add a plot generated in R
- addImage: Add external images
- addTOC: Add a table of contents
- addRScript: highlight and add R code
- addMarkdown: Add markdown
- addPageBreak: Add a page break
After adding contents, you have to use the writeDoc() function to write the Word document into a .docx file.
Add texts : title and paragraphs of texts
Texts can be added as a title or a paragraph using the R functions addTitle() or addParagraph(). A simplified format of these functions are :
addTitle(doc, value, level=1) # Add titlesaddParagraph(doc, value) # Add a paragraph of texts- doc : docx object.
- value : the text to add as a title or a paragraph.
- level : an integer specifying the heading level. e.g : 1 for title1, 2 for title2, 3 for title3, etc.
addTitle() and addParagraph() functions can be used as follow :
library(ReporteRs)# Create a word document to contain R outputsdoc <- docx()# Add a title to the documentdoc <- addTitle(doc, "Simple Word document", level=1)# Add a paragraph of text into the Word document doc <- addParagraph(doc, "This simple Word document is created using R software and ReporteRs package. It contains just a simple text.")# Add a sub titledoc <- addTitle(doc, "What is R language?", level = 2) doc <- addParagraph(doc, "R is a language and environment for statistical computing and graphics. R provides a wide variety of statistical and graphical techniques, and is highly extensible.")doc <- addTitle(doc, "What is ReporteRs", level = 2)doc <- addParagraph(doc, "ReporteRs is a package to write and format easily a Word document from R software.")# Write the Word document to a file writeDoc(doc, file = "r-reporters-simple-word-document.docx")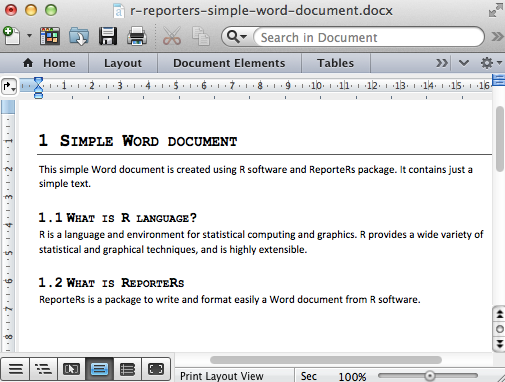
Format the text of a Word document using R software
Text properties : font, color, size
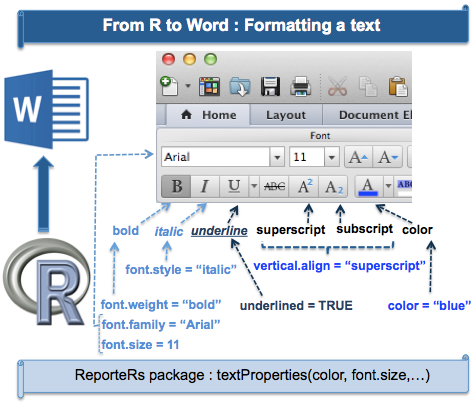
Among the text properties available in a Word document, there are :
font family (e.g : “Arial”), font size (e.g : 11), font weight (e.g: bold), font style (e.g : italic), underlined text, vertical align(superscript, subscript) and color (e.g: “blue”).
These properties are shown in the figure below :
 .
.
Change the global font size and font family
The default font size and font family can be changed as follow :
options( "ReporteRs-fontsize" = 12, "ReporteRs-default-font" = "Arial")Change the appearance of a “Piece Of Text” (pot)
 .
.
The function pot() [Pieces Of Text] is used to format text chunks before adding into the document. pot() function can be also used to create a hyperlink and a footnote. A simplified format is :
pot(value="", format = textProperties())- value : the text to be formatted
- format : the properties to use for formatting the text
The possible values for the parameter format are the following functions :
- textProperties() : the text formatting properties
- textBold() : shortcut for bold text
- textItalic() : shortcut for italic text
- textBoldItalic() : shortcut for bold-italic text
- textNormal() : shortcut for normal text
The arguments for these functions are :
- color : font color; e.g : color=“#000000” or color = “black”.
- font.size : a integer indicating the font size.
- font.weight : the font weight. Possible values are “normal” or “bold”.
- font.style : the font style. Possible values are “normal” or “italic”.
- underlined : a logical value specifying if the text should be underlined.
- font.family : the font family; e.g : “Arial”.
- vertical.align : a character indicating font vertical alignments. Expected values are “baseline”" or “subscript” or “superscript”. Default value is baseline.
- shading.color : background color of the text (e.g “#000000” or “black”)
pot() function can be used as follow :
# Formatted textmy_text <- 'This is a ' + pot('formatted text', textProperties(color="blue")) + ' created using' + pot('ReporteRs', textBold()) + 'package'# Create a hyperlynkmy_link <- pot( 'Click here to visit STHDA website!', hyperlink = 'http://www.sthda.com/english', format=textBoldItalic(color = '#428BCA', underline = TRUE ))The R code below creates a Word document containing a formatted text and a hyperlink :
doc <- docx() # Change the default font size and font familyoptions('ReporteRs-fontsize'=12, 'ReporteRs-default-font'='Arial')# Add a formatted paragraph of texts#++++++++++++++++++++++++++++++doc <- addTitle(doc, "Formatted text", level=1)# Define a style to highlight a texthighlight_style <- textProperties(color='#1163A5',font.size = 20, font.weight = 'bold', font.family = 'Courier New' )my_text = 'This ' + pot('Word document', highlight_style) + ' is created using' + pot(' R software', textProperties(color="red", font.size=18)) + ' and'+ pot(' ReporteRs', textBoldItalic(color="#F0A91B", underlined=TRUE)) + ' package.'doc <- addParagraph(doc, my_text)# Add a hyperlinkdoc <- addTitle(doc, "STHDA Web site", level=1)my_link <- pot('Click here to visit STHDA web site!', hyperlink = 'http://www.sthda.com/english', format=textBoldItalic(color = 'blue', underline = TRUE ))doc <- addParagraph(doc, my_link)# Write the Word document to a file writeDoc(doc, file = "r-reporters-formatted-word-document.docx")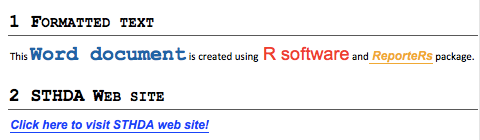
Add plots and images
The functions addPlot() and addImage() can be used for adding a plot or an external image to the document. addPlot() works with all R plots (base graphics, lattice, ggplot2 and grid).
The format of these 2 functions are :
# Add plots# fun : R plotting function# ... : other arguments to pass to the plotting functionaddPlot(doc, fun, ...)# Add images# filename : path to the external imageaddImage(doc, filename)The R code below creates a Word document containing an introduction, a box plot, a histogram and an image (downloaded from STHDA web site).
doc <- docx() # Create a Word document# Add a titledoc <- addTitle(doc, "Word document with plots and Images", level = 1)# Add an introductiondoc <- addTitle(doc, "Introduction", level = 2)doc = addParagraph(doc, value ="This Word document is created using R software and ReporteRs package. The goal of this section is to show you how to add plots and images into a Word document. This can be done easily using the functions addPlot() and addImages().")# Add a box plotdoc <- addTitle(doc, "Box plot using R software", level = 2)boxplotFunc<-function(){ boxplot(len ~ dose, data = ToothGrowth, col = rainbow(3), main = "Guinea Pigs' Tooth Growth", xlab = "Vitamin C dose mg", ylab = "tooth length")}doc <- addPlot(doc, boxplotFunc) doc <- addPageBreak(doc) # Go to the next page# Add a histogramdoc <- addTitle(doc, "Histogram plot", level = 2)doc <- addPlot(doc, function() hist(iris$Sepal.Width, col="lightblue"))# Change point size of plotted text (in pixels, default = 12)doc <- addTitle(doc, "Histogram with pointsize = 18", level = 2)doc <- addPlot(doc, function() hist(iris$Sepal.Width,col="lightblue"), pointsize=18)# Add an image# +++++++++++++++++++++++++++# download an image from STHDA web sitedownload.file(url="http://www.sthda.com/sthda/RDoc/figure/easy-ggplot2/ggplot2-histogram-demo.png", destfile="ggplot2-histogram-demo.png", quiet=TRUE)doc <- addTitle(doc, "Image from STHDA web site", level = 2)doc <- addImage(doc, "ggplot2-histogram-demo.png")# Write the Word document to a file writeDoc(doc, file = "r-reporters-word-document-with-plot.docx")Note that, for addPlot() function, you can use the arguments width and height to specify the plot width and height in inches (default values are 6 X 6)
Another optional argument of addPlot() function is par.properties which value can be parRight(), parLeft(), parJustify() for the plot alignments:
doc <- addPlot( doc = doc, fun = function(){ barplot( 1:5, par.properties = parCenter() )} )- For addImage() function, the allowed file formats are PNG, WMF, JPEG and GIF images..
Add a table
The function addFlexTable() is used to add a simple or customized table.
- The first step is to create a table using one of the functions below :
- FlexTable() to create a ‘flexible’ table which can be easily formatted
- vanilla.table() which is shortcut to quickly produce a nice FlexTable
- The second step is to add the created table into the Word document using addFlexTable() function as follow :
# doc : docx object# flextable : FlexTable objectaddFlexTable(doc, flextable)Add a simple table
doc <- docx()data<-iris[1:5, ]# Add a first table : Default tabledoc <- addTitle(doc, "Default table")doc <- addFlexTable( doc, FlexTable(data))doc <- addParagraph(doc, c("", "")) # 2 line breaks# Add a second table, theme : vanilla tabledoc <- addTitle(doc, "Vanilla table")doc <- addFlexTable( doc, vanilla.table(data))writeDoc(doc, file = "r-reporters-word-document-add-table.docx")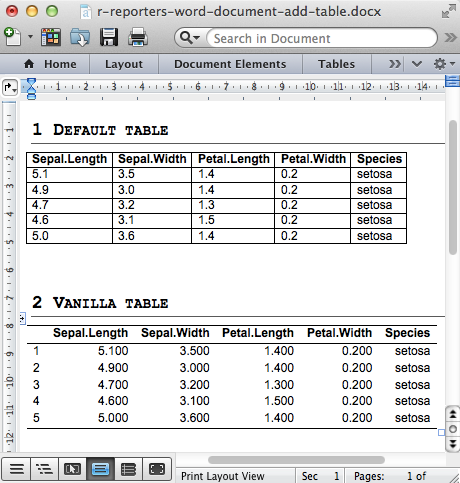
Add a zebra striped table
setZebraStyle() function can be used to color odd and even rows differently; for example, odd rows in gray color and even rowsin white color.
doc <- docx()data<-iris[1:5, ]# Zebra striped tablesdoc <- addTitle(doc, "Zebra striped tables")MyFTable <- vanilla.table(data)MyFTable <- setZebraStyle(MyFTable, odd = '#eeeeee', even = 'white')doc <- addFlexTable( doc, MyFTable)writeDoc(doc, file = "r-reporters-word-document-zebra.docx")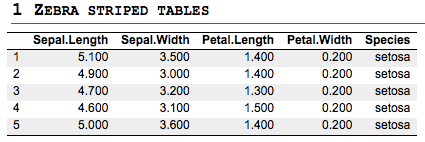
Add lists : ordered and unordered lists
Ordered and unordered lists can be added using addParagraph() function as follow :
doc = addParagraph(doc, value = c('Item 1', "Item 2", "Item 3") par.properties = parProperties(list.style = 'ordered', level = 1 )- value : a set of texts to be added as a list
- par.properties : the paragraph formatting properties
- list.style : possible values are ‘unordered’ and ‘ordered’
- level : a numeric value indicating the level of the item to be added in the list
Add simple lists
doc <- docx()# Ordered listdoc <- addTitle(doc, "Ordered List")doc <- addParagraph(doc, value= c("Item 1", "Item 2", "Item 3"), par.properties = parProperties(list.style = 'ordered'))# Unordered listdoc <- addTitle(doc, "Unordered List")doc <- addParagraph(doc, value= c("Item 1", "Item 2", "Item 3"), par.properties = parProperties(list.style = 'unordered'))writeDoc(doc, file = "r-reporters-word-document-lists.docx")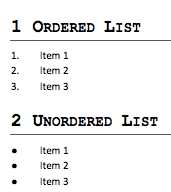
Add multi-level lists
To simplify the code, we’ll first define some levels to be used for creating multi-level lists.
doc <- docx()# Define some levels for ordered lists (ol)ol1 = parProperties(list.style = "ordered", level = 1)ol2 = parProperties(list.style = "ordered", level = 2)# Define some levels for unordered lists (ul)ul1 = parProperties(list.style = "unordered", level = 1)ul2 = parProperties(list.style = "unordered", level = 2)# Multi-lvel ordered listdoc <- addTitle(doc, "Ordered List")doc <- addParagraph(doc, value= "Item 1", par.properties = ol1)doc <- addParagraph(doc, value= "Item 1.1", par.properties = ol2)doc <- addParagraph(doc, value= "Item 1.2", par.properties = ol2)doc <- addParagraph(doc, value= "Item 2", par.properties = ol1)# Multi-lvel unordered listdoc <- addTitle(doc, "Unordered List")doc <- addParagraph(doc, value= "Item 1", par.properties = ul1)doc <- addParagraph(doc, value= "Item 1.1", par.properties = ul2)doc <- addParagraph(doc, value= "Item 1.2", par.properties = ul2)doc <- addParagraph(doc, value= "Item 2", par.properties = ul1)writeDoc(doc, file = "r-reporters-word-document-multilevel-lists.docx")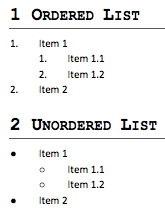
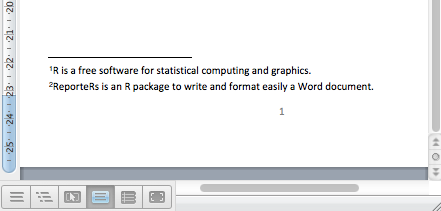
Add a footnote to a Word document
A footnote is a set of paragraphs written at the bottom of the Word document.

The steps for adding a footnote into a document are :
- Create a footnote object using the function Footnote()
- Add a text to the footnote using the function addParagraph()
library(ReporteRs)doc <- docx()# create footnotesfootnote1 <- Footnote( ) # footnote1 about Rfootnote1 <- addParagraph(footnote1, "R is a free software for statistical computing and graphics.")footnote2 <- Footnote( ) # footnote2 about ReporteRs packagefootnote2 <- addParagraph(footnote2, "ReporteRs is an R package to write and format easily a Word document.")# Use the footnotes when writing a paragraph into the documentdoc <- addTitle(doc, "Word document with a footnote", level=1)doc <- addParagraph(doc, "This Word document is created using " + pot("R software", footnote=footnote1)+ " and "+ pot("ReporteRs", footnote=footnote2) +" package." )writeDoc(doc, file = "r-reporters-word-document-footnote.docx")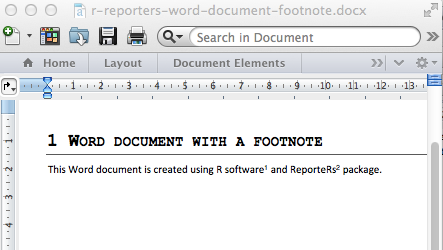
Add R scripts
The function addRScript() can be used as follow :
doc <- docx()r_code <- 'summary(cars$dist)x <- rnorm(100)hist(x)'# Change the backgroud-colordoc <- addRScript(doc, text = r_code, par.properties= parProperties(shading.color = 'gray90'))writeDoc(doc, file = "r-reporters-word-add-r-code.docx")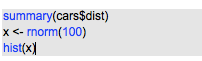
Add a table of contents into a Word document
To add a table of contents, the function addTOC() can be used.
doc <- docx() # Create a Word document# Add a titledoc <- addTitle(doc, "Create a Word document with TOC", level = 1)# Add a table of contentsdoc <- addTOC(doc)doc <- addPageBreak(doc) # go to the next page# Add an introductiondoc <- addTitle(doc, "Introduction", level = 2)doc = addParagraph(doc, value ="This Word document is created using R software and ReporteRs package. The goal of this section is to show you how to add a table of contents into a Word document. This can be done easily using the function addTOC.")# Add a box plotdoc <- addTitle(doc, "Box plot using R software", level = 2)boxplotFunc<-function(){ boxplot(len ~ dose, data = ToothGrowth, col = rainbow(3), main = "Guinea Pigs' Tooth Growth", xlab = "Vitamin C dose mg", ylab = "tooth length")}doc <- addPlot(doc, boxplotFunc) doc <- addPageBreak(doc) # go to the next page# Add plots#+++++++++++++++++++++doc <- addTitle(doc, "Basic plots using R software", level = 2)doc <- addParagraph(doc, "R is a free software for plotting and data analysis. This chapter contains examples of graphs generated using R.")# Add a histogramdoc <- addTitle(doc, "Histogram", level = 3)doc <- addPlot(doc, function() hist(iris$Sepal.Width, col="lightblue"))doc <- addPageBreak(doc) # go to the next page# Add a bar plotdoc <- addTitle(doc, "Bar plot", level = 3)doc <- addPlot(doc, function() barplot(VADeaths))# Write the Word document to a file writeDoc(doc, file = "r-reporters-word-document-toc.docx")Infos
You can read more about ReporteRs and download the source code at the following link :
GitHub (David Gohel): ReporteRs
- Create and format Word documents using R software and Reporters package
- Create Ms Word doc using Javascript And vbscript
- Create Ms Word doc using Javascript And vbscript .
- Create and manipulate PDF documents - 100% .NET
- Word documents using XSLT
- Microsoft Office Word、Excel and PowerPoint 2007 file format compatible package
- #R#R presentation and Shiny package
- Create and deploy SSIS package steps
- Create and maintain your own bower package
- Saving Word 2007 Documents to PDF and XPS Formats
- How to create Web Deployment Package and install the package
- Step to create Package, deploy and create SQL agent job
- Csharp: Create Excel Workbook or word from Template File using aspose.Word 14.5 and aspose.Cell 8.1
- Csharp: Create Excel Workbook or word from Template File using aspose.Word 14.5 and aspose.Cell 8.1
- R Extension package category and search
- create GUI using pygtk and glade3
- 《css and documents》读书笔记;
- Classifying Texts and Documents
- Mac安装android sdk
- Struts2基础
- mysql5.7 配置开启log
- 一句话木马
- win64 Python下安装PIL出错解决
- Create and format Word documents using R software and Reporters package
- Java多线程的笔记
- thinkphp D方法与M方法
- spring mvc 注解配置StringHttpMessageConverter不生效
- Openstack nova 热迁移绿色thread分析
- linux 7
- Java并发编程:volatile关键字解析
- 图片选择器
- Android 弃暗投明之Handler