Building Integrated SQL Server Business Intelligence (BI) Solutions with Microsoft Office 2007
来源:互联网 发布:数据统计html 编辑:程序博客网 时间:2024/04/29 19:44
Building Integrated SQL Server Business Intelligence (BI) Solutions with Microsoft Office 2007
Written By: Ray Barley -- 3/26/2009 -- 3 comments ![]()
![]()
![]()
![]()
![]()
Stay informed - get the MSSQLTips.com newsletter and win - click here
Problem
I am trying to understand the BI capabilities built in to the various components of Microsoft Office 2007 and figure out how to leverage them to create BI solutions for our business users. Can you provide an overview of the capabilities?
Solution
As a starting point let's assume that you have a data warehouse built on SQL Server 2005 or SQL Server 2008 including some SQL Server Analysis Services (SSAS) cubes. We'll frame our discussion of the BI capabilities in Microsoft Office 2007 with the following diagram:
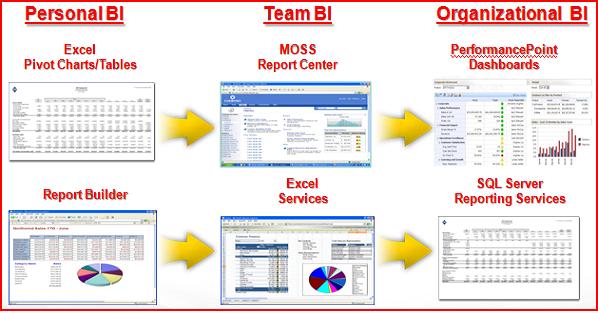
As shown in the above diagram, the BI components of Office 2007 are:
- Excel 2007
- Report Builder
- Microsoft Office SharePoint Server 2007 (MOSS)
- Excel Services
- PerformancePoint Services
The diagram above also includes SQL Server Reporting Services (SSRS) which is not part of Office; however, reports built with Report Builder can be deployed to an SSRS server and SSRS is a key component of the overall SQL Server BI offering. Now let's discuss these BI capabilities in the context of Personal, Team and Organizational BI.
Personal BI
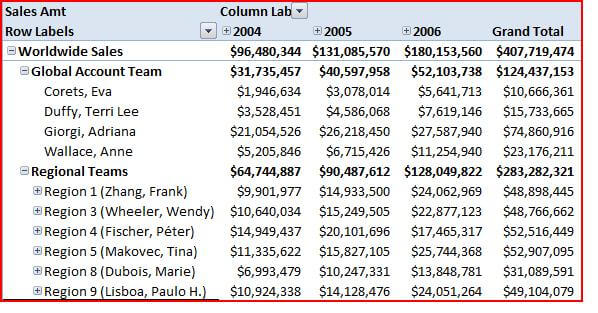
Personal BI is all about business users performing analysis on their own utilizing familiar tools. Business users have been leveraging Excel to perform this analysis for many years. Excel 2007 includes an intuitive user interface for querying SSAS cubes to create pivot charts and tables. Below is an example of a pivot table created with Excel 2007:
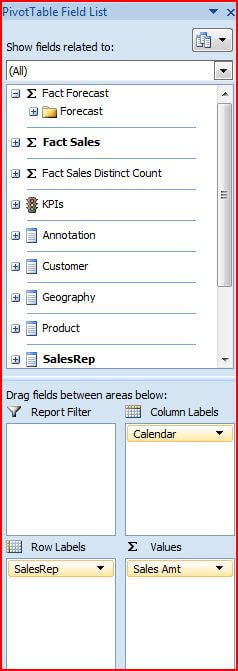
To create a pivot table in Excel 2007 you simply identify the data source, then drag and drop fields from the pivot table field list onto the rows, columns and values as shown below:
The pivot table leverages the hierarchies defined in the cube and allows users to navigate the data by collapsing and expanding to dig deeper into the data.
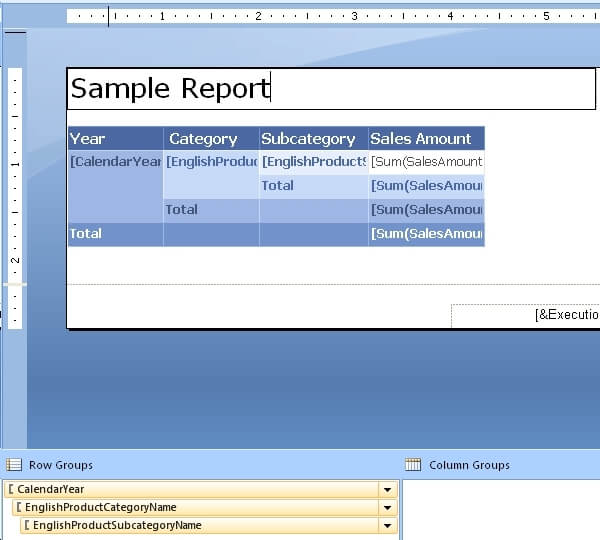
Beginning with SQL Server 2005, Report Builder became available to give business users the capability to create their own reports in a user-friendly, non-developer interface. SQL Server 2008 offers a new and improved Report Builder, aptly titled Report Builder 2.0. Report Builder 2.0 further refines the user interface and in fact implements the now familiar Office 2007 ribbon bar. An example of the user interface for building a report is shown below:
An example of the above report rendered in Report Builder 2.0 is shown below:
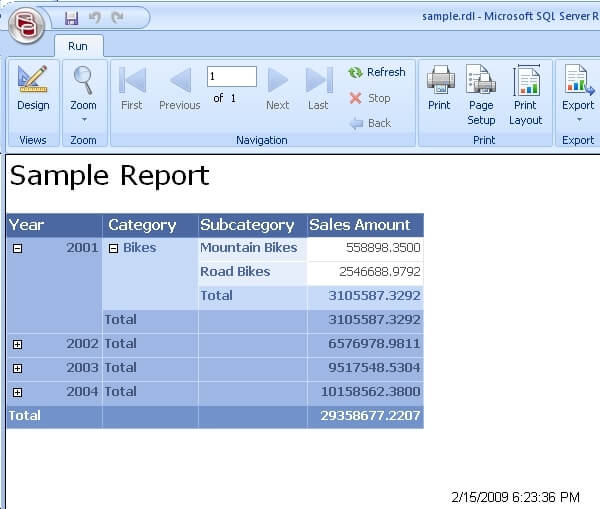
Take a look at our earlier tip Introduction to Report Builder 2.0 for a detailed example of creating reports with this new tool.
Team BI
Team BI is the logical extension of Personal BI. Business users naturally create BI artifacts that are useful to other members of their team and should be deployed in a way that facilitates sharing. SharePoint is the obvious choice for sharing BI among the team. The Microsoft Office SharePoint Server (MOSS) 2007 Enterprise Edition provides Excel Services and the Report Center as built in BI capabilities.
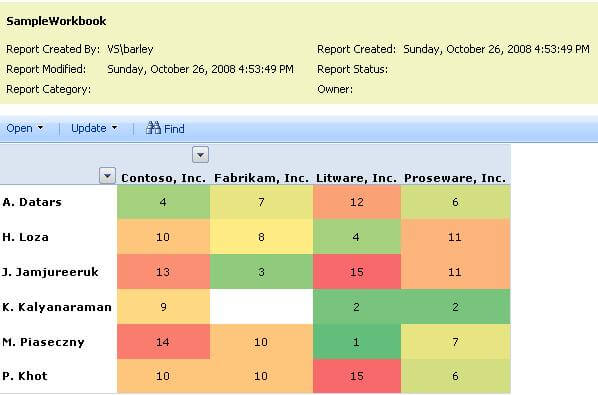
Excel Services provides three capabilities: Excel Web Access (EWA), Excel Calculation Services (ECS) and Excel Web Services (EWS). The starting point is to publish an Excel 2007 spreadsheet to a MOSS document library configured as a Trusted File Location. This is done from Excel 2007 using the Publish menu option. EWA provides the capability to render a published spreadsheet in the browser without requiring Excel 2007 on the desktop. An Excel spreadsheet can be viewed in the browser by clicking on it in the document library or by using the Excel Web Access web part. When publishing the spreadsheet you can allow the entire spreadsheet to be available or just specific items or sheets. Once published to a document library, you can also take advantage of built-in features such as checkin/checkout, versioning, and workflow. MOSS provides a data connection library to store Office Data Connection (ODC) files which are used to connect Excel to external data such as SSAS cubes. Users can access the ODC files stored in SharePoint from their Excel spreadsheets.
The following is an example of an Excel spreadsheet rendered in the browser by clicking on the spreadsheet in the document library:
ECS operates behind the scenes, loading workbooks from Trusted File Locations, performing calculations in the spreadsheet, and refreshing the external data referenced in a spreadsheet. EWS provides a web service interface that can be used to open workbooks, populate cells with data, perform calculations, and retrieve calculation results.
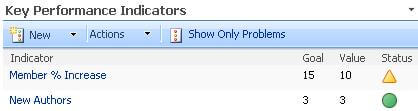
The Report Center is the container for BI solutions in MOSS, providing for the creation and rendering of dashboards. A dashboard is made up of scorecards and reports. A scorecard is a collection of key performance indicators (KPI). What separates a KPI from just a number is the fact that a KPI represents an actual value and a goal or target value along with thresholds that determine whether the value is on target, off target, or way off target. A KPI uses visual indicators such as green, yellow and red lights so we can see at a glance how we're doing. The Report Center includes a KPI list and a web part to render the KPI list as a scorecard. The source for the data in the KPI list can be a SharePoint list, SSAS cube, spreadsheet published to Excel Services, or numbers entered manually. A sample scorecard from a dashboard is shown below:
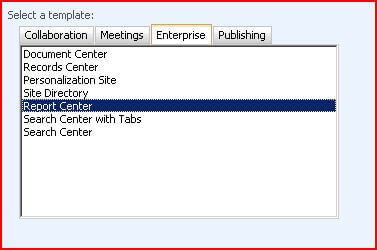
The Report Center is a site template in MOSS. You can create a site based on this template by selecting it from the Enterprise tab during site creation as shown below:
The Report Center also provides the capability to display reports. These reports are sourced from Excel spreadsheets published to Excel Services. Below is a sample chart from an Excel spreadsheet displayed on a dashboard page:
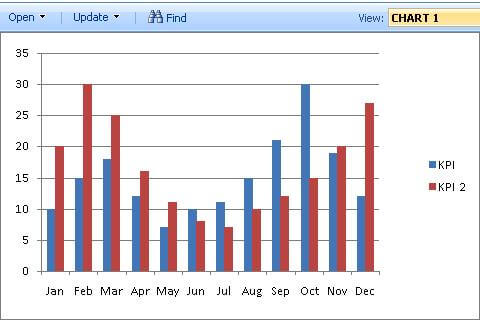
The named range CHART 1 is defined in the spreadsheet to allow the Excel Web Access web part to render just the chart. You can create a named range for each item in the spreadsheet that you might like to render on the dashboard page or via the Excel Web Access web part.
Organizational BI
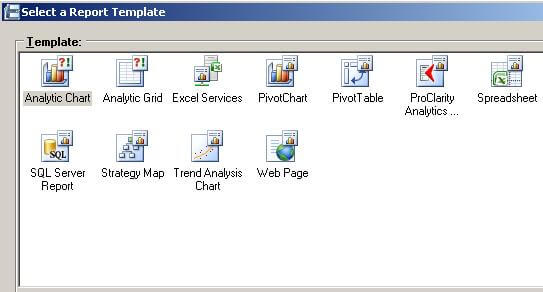
PerformancePoint Services (PPS) is the preferred tool for delivering BI across the organization. PPS provides the Dashboard Designer, an application with the familiar Office 2007 look and feel, that provides users with the capability of designing and deploying dashboards. A dashboard can be made up of scorecards, charts, grids, and a variety of other types of reports. The following screen shot shows the available report types that can be created and rendered in a dashboard:
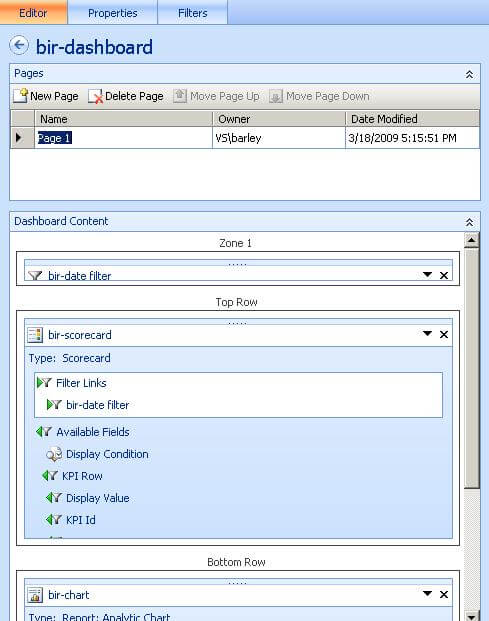
The Dashboard Designer allows you to layout a dashboard then deploy it to a web page in a SharePoint document library. The dashboard supports a variety of filters which can be used to provide interactivity on the dashboard. The following is an example of the Dashboard Designer in action, with a dashboard that includes a time filter, scorecard and an analytic chart:
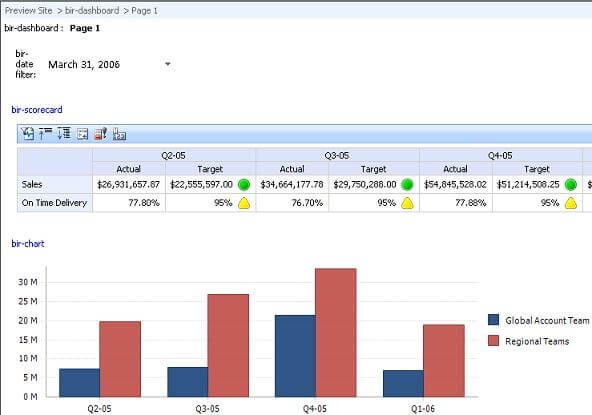
Before deploying a dashboard to SharePoint, the Dashboard Designer provides a preview function which renders the dashboard in a web page. The following is a preview of the above dashboard:
SQL Server Reporting Services (SSRS) can be used to produce the traditional reports that are a component of a BI solution. SSRS reports can be integrated into a PPS dashboard via the SQL Server Report template shown above in the Dashboard Designer's available report types. SSRS reports can also be rendered on a SharePoint web part page using web parts that are distributed with SSRS. Finally the SSRS report server can be configured in SharePoint Integrated Mode, where reports are deployed to SharePoint document libraries and they can be rendered simply by clicking on the report. Take a look at our earlier tip How To Configure SQL Server Reporting Services 2005 to Run in SharePoint Integrated Mode for the details to set this up.
Summary
We have discussed BI from the approach of Personal, Team and Organizational. Once you have built your data warehouse and SSAS cubes, you can start developing the BI front end using any of the approaches depending on your needs. Both Personal and Team are self-service where business users can do the majority of the work on their own. When the Organizational approach leverages PerformancePoint Services, it too can be done by the business users. Building SSRS reports, on the other hand, is probably something that a developer will need to do, although business users can create reports with Report Builder and deploy them to a report server.
Next Steps
- Stay tuned for additional related tips where we will dig deeper into the specific topics discussed in this tip.
- A number of the capabilities discussed in this tip are provided by Microsoft Office SharePoint Server 2007 Enterprise aka MOSS Enterprise which is different than Windows SharePoint Services aka WSS. WSS is available with Windows 2003 Server (no additional licensing fees) and has basic collaboration capabilities. However, WSS does not include the BI capabilities discussed in this tip such as the Report Center site template, Excel Services, and PerformancePoint Services. Take a look at What is Microsoft Office SharePoint Server to understand the differences between WSS and MOSS.
- Building Integrated SQL Server Business Intelligence (BI) Solutions with Microsoft Office 2007
- Business Intelligence with Microsoft® Office PerformancePoint Server 2007
- Pro PerformancePoint Server 2007: Building Business Intelligence Solutions
- Microsoft ® Office 2007 Business Intelligence
- The Microsoft Data Warehouse Toolkit: With SQL Server 2005 and the Microsoft Business Intelligence T
- Practical Business Intelligence with SQL Server 2005
- Tricks of the Microsoft Office 2007 Gurus (Business Solutions)
- Microsoft SharePoint: Building Office 2007 Solutions in C# 2005
- Microsoft SharePoint: Building Office 2007 Solutions in VB 2005
- Microsoft SharePoint: Building Office 2003 Solutions
- Microsoft SharePoint: Building Office 2003 Solutions
- 什么是BI(Business Intelligence)
- BI(Business Intelligence)
- Foundations of SQL Server 2005 Business Intelligence
- 开始学习 Microsoft SharePoint: Building Office 2003 Solutions
- Microsoft SharePoint: Building Office 2003 Solutions, Second Edition
- 书评《Deploying Messaging Solutions with Microsoft Exchange Server 2007》
- 什么是BI(Business Intelligence)
- 实时验证用户输入的js代码
- pervasive数据集成器(Pervasive Data Integrator)
- SQL Server ID自增列重新从1开始算起
- 什么是接口
- sqlsever 数据库收缩处理
- Building Integrated SQL Server Business Intelligence (BI) Solutions with Microsoft Office 2007
- MIDI 音乐不出声的原因
- Windows Server 2008 R2 beta Evaluation SN
- JavaScript高级---自定义对象
- SQL统计哪些表使用分区表
- 人比事更烦心
- 网页对话框showModalDialog
- 接到前前老板给我推荐工作的电话
- basepage