Scheduling a SQL Server Profiler Trace
来源:互联网 发布:台服lol有mac版本吗 编辑:程序博客网 时间:2024/05/22 07:45
Scheduling a SQL Server Profiler Trace
Written By: David Bird -- 3/25/2009 -- 0 comments ![]()
![]()
![]()
![]()
![]()
Stay informed - get the MSSQLTips.com newsletter and win - click here
Problem
You want to schedule a trace, but SQL Profiler does not have a built-in scheduling option. So how do you use SQL Agent to schedule a SQL Profiler trace?
Solution
SQL Profiler traces are built using system stored procedures. You can use the SQL commands from an existing profiler trace and construct your own stored procedure that creates and starts a SQL Profiler trace. You will need to specify some additional settings using your stored procedure. These include run duration, file size, and trace output file location. Instructions on how to create, execute, and stop the profiler trace using this stored procedure are covered in detail.
Create the Trace Definition
The most efficient means to define the SQL commands used for constructing a profiler trace is to use SQL Profiler.
- Start SQL Profiler and select File > New Trace. Specify the events, columns, and filters you want in your trace.
- Start the trace and then stop it.
- Export the definition. Click File > Export > Script Trace Definition > For SQL Server 2005
Note: For SQL Sever 2000 and 2008 choose the appropriate output type. - Save the trace file.
Create a Profile Trace Stored Procedure
Next, take the exported trace definition and use it to create a stored procedure.
- Use SSMS to open the exported trace definition created above.
- Open another query window in SSMS and paste the trc_template stored procedure code from below.
- In the exported trace definition, find '-- Set the events' section. Copy all the lines until the next comment line which should be '-- Set the Filters'
- Paste these lines into the stored procedure template after the line "add the '-- Set the events' section below"

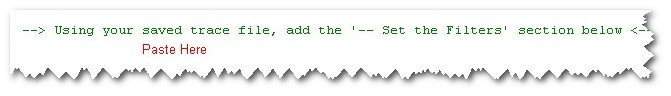
- Next find the '-- Set the Filters' section in the exported trace definition. Copy all the lines until the '-- Set the trace status to start'
- Paste these lines into the stored procedure template after the line "add the '-- Set the Filters' section below"
- Change the stored procedure name using your naming conventions.
- In the SQL code, the profiler stop time is set using the variable @StopTime. The current setting is for 60 minutes after the trace is started. Adjust this setting to what is appropriate.
- Set the @MaxFileSize to an appropriate size for the trace output file. Currently, it is set to 50 megabytes.
- Save the stored procedure code under a new file name other than trc__Template.sql
Preparing the Server
- Create a folder on the server that will be used to contain the profiler trace files.
- Enable XP_CMDSHELL on SQL Server 2005 and 2008. If you do not want to leave this feature enabled all the time, you can wrap commands around the start procedure command that enables XP_CMDSHELL, starts the trace, and then disables XP_CMDSHELL (see sample command below).
- Create the stored procedure on the SQL Server instance using the file that you created above. It can be created in any user database. In the example below, it has been created in the database named Admin.
- Create a job in SQL Agent to execute the stored procedure. Do not start the job until you have tested the stored procedure.
- The @Folder must specify an existing folder on the server. A sub folder is created by the stored procedure using the start date and time. This will ensure that a new, unique trace is always created.
Running the Profile Trace
- Before running your SQL Agent Job, you should test your stored procedure.
- Using SSMS with "Results to Text' active, execute the stored procedure using the command defined in your SQL Agent Job.
- If no errors occur, it should be running. To verify this, execute this select "select * FROM ::fn_trace_getinfo(default)".
Sample Output

Stop the Profiler Trace
- To stop the profiler trace before its end time has occurred you exec two commands. One stops the trace and the other closes the trace file.
- Here are the commands:
- Execute "select * FROM ::fn_trace_getinfo(default)"
- Identify the traceid you using the folder name specified when starting the trace.
- Execute these two commands replacing # with the trace id.
EXEC sp_trace_setstatus @traceid = #, @status = 0; -- Stop/pause Trace
EXEC sp_trace_setstatus @traceid = #, @status = 2; -- Close trace and delete it from the server
- Verify it has stopped by executing "select * FROM ::fn_trace_getinfo(default)"
- To view the captured trace files, open them using SQL Server Profiler.
- Old profiler trace files are not automatically deleted. You will need to delete them your-self when you are finished.
Attached Files
The ZIP file attached to this article contains the stored procedure template, SQL scripts, and a couple of sample traces. One sample trace captures login failures; which is very useful on SQL Server 2000 because it identifies the client name and IP address. The second collects performance data use by the Database Index Advisor for making recommendations.
Conclusion
This method of scheduling a SQL Profiler trace has been tested on SQL Server 2000, 2005, and 2008. At first creating these traces might seem a little complex, but after time it will get to become second nature. Having a ready-made trace you can run whenever an issue occurs will save time in reacting to and diagnosing a problem.
Next Steps
- Create a collection of profile traces you can run when needed
- Use Database Tuning Advisor to review your performance traces
- Additional Resources:
- SQLDBATips.com sample Stored Procedure
- SQL Profiler Command Line Options
- File Attachment
- Scheduling a SQL Server Profiler Trace
- SQL Server 2005 Profiler 创建 trace 失败:Only TrueType Fonts are supported. This is not a TrueType font
- 每小时自动生成一个SQL Server Profiler文件(Auto Generate an Hourly SQL Server Profiler Trace File)
- SQL Server Profiler 模板
- SQL Server Profiler工具
- SQL Server Profiler 模板
- SQL Server Profiler使用方法
- SQL Server Profiler工具
- SQL Server Profiler
- SQL Server Profiler使用方法
- Sql Server profiler 分析器
- SQL Server Profiler工具
- SQL Server Profiler使用方法
- SQL Server Profiler使用方法
- SQL Server Profiler使用方法
- SQL Server Profiler工具
- SQL Server Profiler使用方法
- SQL Server Profiler 使用方法
- oracle to buy sun (纪念)
- Spring + RMI + JND实现远程调用
- javascript confirm 确认要删除吗?
- JavaScript 学习点滴记录
- 思考
- Scheduling a SQL Server Profiler Trace
- 关于aix下xmanager、cde、ftp、telnet问题的小结
- The ARM Architecture
- 用NUnit为.NET程序做测试 ---Nunit入门
- Capture all statements for a SQL Server session
- 自主开发自动化测试工具(一)
- 24 个漂亮的个性化 HTML 表单技术
- 文本编辑框--调整文本编辑区域
- Using TRY/CATCH to Resolve a Deadlock in SQL Server 2005