matplotlib的一些基本设置的记录
来源:互联网 发布:wifi速度测试软件 编辑:程序博客网 时间:2024/05/16 04:11
Matplotlib可能是Python 扩展包中仅有的最流行的 2D 绘图库。她不仅提供了快速的方式可视化Python中的数据,而且提供流行的图形格式的选择。
pyplot 是非常接近 Matlab 的一个函数库,承担了大部分的绘图任务。我们可以通过以下命令引入pyplot.
from matplotlib import pyplot as plt
文档链接:
http://matplotlib.org/users/pyplot_tutorial.html
plot() command
matplotlib 中提供了一系列的参数,比如 图形大小(figure size),图形质量(dpi), 线宽(linewidth), 颜色和样式(color and style), axes, axis and grid properties, text and font properties 等等。
设置1:图像的大小设置。
如果已经存在figure对象,可以通过以下代码设置尺寸大小:
f.set_figheight(15)f.set_figwidth(15)若果通过.sublots()命令来创建新的figure对象, 可以通过设置figsize参数达到目的。
f, axs = plt.subplots(2,2,figsize=(15,15))设置2:刻度和标注特殊设置
描述如下:在X轴标出一些重要的刻度点,当然实现方式有两种:直接在X轴上标注和通过注释annotate的形式标注在合适的位置。
其中第一种的实现并不是很合适,此处为了学习的目的一并说明下。
先说第一种:
正常X轴标注不会是这样的,为了说明此问题特意标注成这样,如此看来 0.3 和 0.4的标注重叠了,当然了解决重叠的问题可以通过改变figure 的size实现,显然此处并不想这样做。
怎么解决呢,那就在 0.3 和 0.4之间再设置一个刻度,有了空间后不显示即可。
代码如下:
# -*- coding: utf-8 -*-import matplotlib.pyplot as pltfig = plt.figure(figsize=(3, 3)) ax = fig.add_subplot(1, 1, 1, frameon=False)ax.set_xlim(-0.015, 1.515)ax.set_ylim(-0.01, 1.01)ax.set_xticks([0, 0.3, 0.4, 1.0, 1.5])#增加0.35处的刻度并不标注文本,然后重新标注0.3和0.4处文本ax.set_xticklabels([0.0, "", "", 1.0, 1.5])ax.set_xticks([0.35], minor=True)ax.set_xticklabels(["0.3 0.4"], minor=True)#上述设置只是增加空间,并不想看到刻度的标注,因此次刻度线不予显示。for line in ax.xaxis.get_minorticklines():line.set_visible(False)ax.grid(True)plt.show()最终图像形式如下:
当然最合理的方式是采用注释的形式,比如:
代码如下:
# -*- coding: utf-8 -*-import matplotlib.pyplot as pltimport numpy as np# Plot a sinc functiondelta=2.0x=np.linspace(-10,10,100)y=np.sinc(x-delta)# Mark deltaplt.axvline(delta,ls="--",color="r")plt.annotate(r"$\delta$",xy=(delta+0.2,-0.2),color="r",size=15)plt.plot(x,y)设置3:增加X轴与Y轴间的间隔,向右移动X轴标注一点点即可
显示效果对比:
设置前:
设置后:
两张的图像的差别很明显,代码如下:
# -*- coding: utf-8 -*-import matplotlib.pyplot as pltfig = plt.figure()ax = fig.add_subplot(111)plot_data=[1.7,1.7,1.7,1.54,1.52]xdata = range(len(plot_data))labels = ["2009-June","2009-Dec","2010-June","2010-Dec","2011-June"]ax.plot(xdata,plot_data,"b-")ax.set_xticks(range(len(labels)))ax.set_xticklabels(labels)ax.set_yticks([1.4,1.6,1.8])# grow the y axis down by 0.05ax.set_ylim(1.35, 1.8)# expand the x axis by 0.5 at two endsax.set_xlim(-0.5, len(labels)-0.5)plt.show()设置4:移动刻度标注
上图说明需求:
通过设置 set_horizontalalignment()来控制标注的左右位置:
for tick in ax2.xaxis.get_majorticklabels(): tick.set_horizontalalignment("left")当然标注文本的上下位置也是可以控制的,比如:
ax2.xaxis.get_majorticklabels()[2].set_y(-.1)当然控制刻度标注的上下位置也可以用labelpad参数进行设置:
pl.xlabel("...", labelpad=20) 或:
ax.xaxis.labelpad = 20具体设置请查阅官方文档,完整的代码如下:
# -*- coding: utf-8 -*-import matplotlib.pyplot as pltimport numpy as npimport datetime# my fake datadates = np.array([datetime.datetime(2000,1,1) + datetime.timedelta(days=i) for i in range(365*5)])data = np.sin(np.arange(365*5)/365.0*2*np.pi - 0.25*np.pi) + np.random.rand(365*5) /3# creates fig with 2 subplotsfig = plt.figure(figsize=(10.0, 6.0))ax = plt.subplot2grid((2,1), (0, 0))ax2 = plt.subplot2grid((2,1), (1, 0))## plot datesax2.plot_date( dates, data )# rotates labels plt.setp( ax2.xaxis.get_majorticklabels(), rotation=-45 ) # shift labels to the rightfor tick in ax2.xaxis.get_majorticklabels(): tick.set_horizontalalignment("right")plt.tight_layout()plt.show()设置5:调整图像边缘及图像间的空白间隔
图像外部边缘的调整可以使用plt.tight_layout()进行自动控制,此方法不能够很好的控制图像间的间隔。
如果想同时控制图像外侧边缘以及图像间的空白区域,使用命令:
plt.subplots_adjust(left=0.2, bottom=0.2, right=0.8, top=0.8,hspace=0.2, wspace=0.3)设置6:子图像统一标题设置。
效果如下(subplot row i):
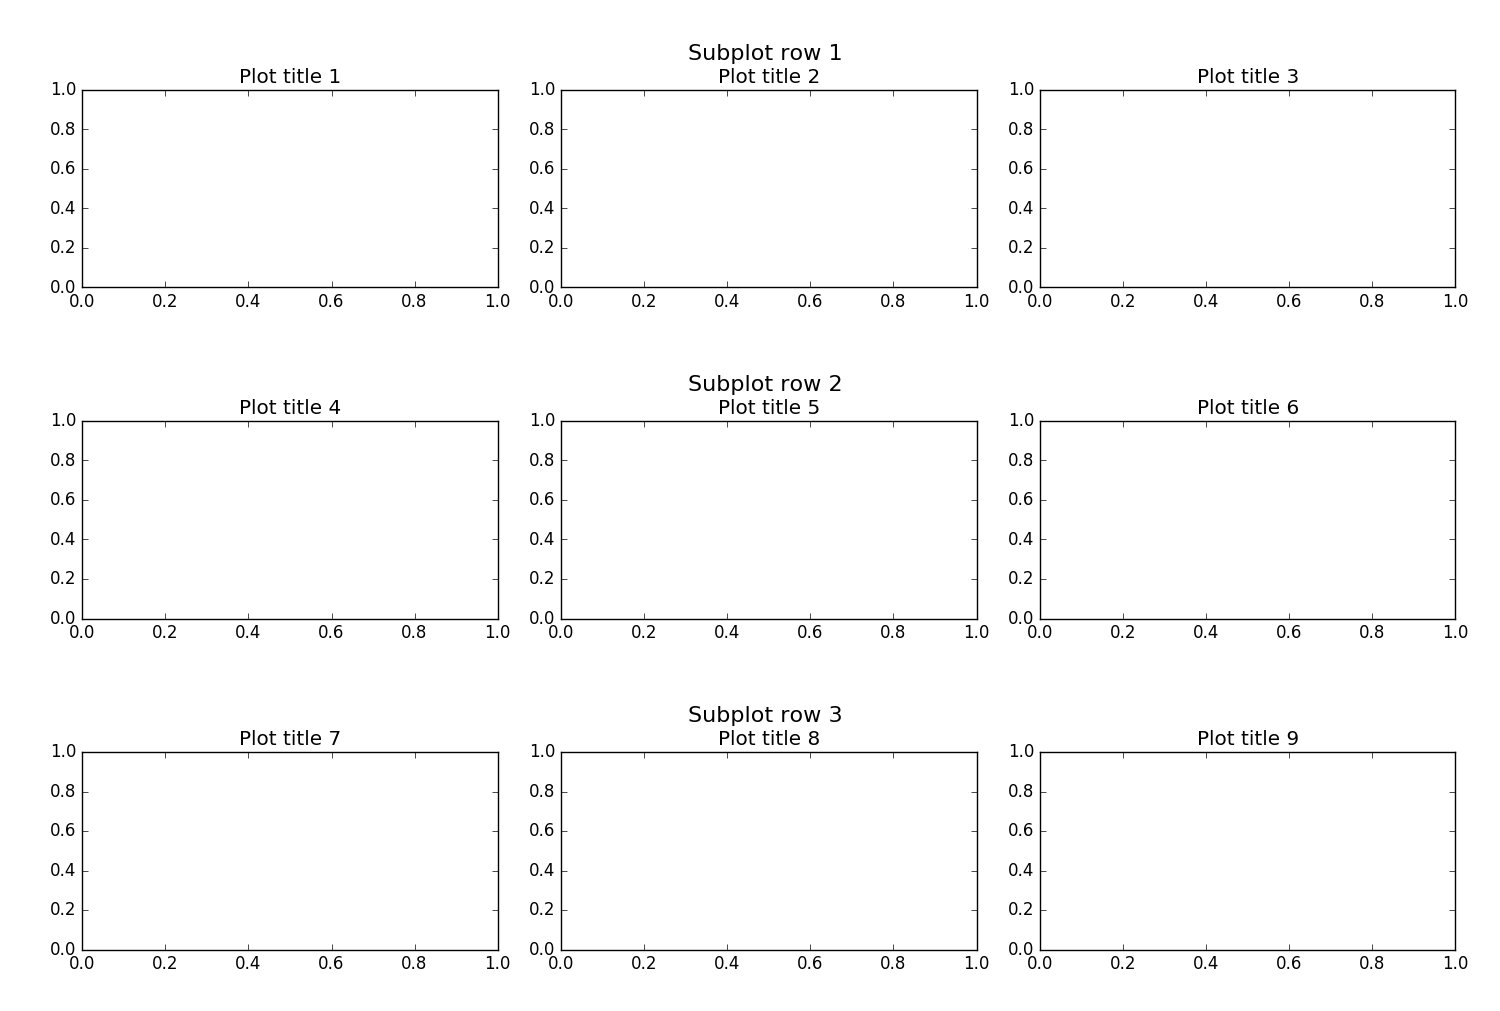
思路其实创建整个的子图像,然后将图像的刻度、标注等部分作不显示设置,仅仅显示图像的 title。
代码如下:
import matplotlib.pyplot as pltfig, big_axes = plt.subplots(figsize=(15.0, 15.0) , nrows=3, ncols=1, sharey=True) for row, big_ax in enumerate(big_axes, start=1): big_ax.set_title("Subplot row %s \n" % row, fontsize=16) # Turn off axis lines and ticks of the big subplot # obs alpha is 0 in RGBA string! big_ax.tick_params(labelcolor=(0,0,0,0), top='off', bottom='off', left='off', right='off') # removes the white frame big_ax._frameon = Falsefor i in range(1,10): ax = fig.add_subplot(3,3,i) ax.set_title('Plot title ' + str(i))fig.set_facecolor('w')plt.tight_layout()plt.show() 设置7:图像中标记线和区域的绘制
效果如下:
代码如下:
import numpy as npimport matplotlib.pyplot as pltt = np.arange(-1, 2, .01)s = np.sin(2*np.pi*t)plt.plot(t, s)# draw a thick red hline at y=0 that spans the xrangel = plt.axhline(linewidth=4, color='r')# draw a default hline at y=1 that spans the xrangel = plt.axhline(y=1)# draw a default vline at x=1 that spans the yrangel = plt.axvline(x=1)# draw a thick blue vline at x=0 that spans the upper quadrant of# the yrangel = plt.axvline(x=0, ymin=0.75, linewidth=4, color='b')# draw a default hline at y=.5 that spans the middle half of# the axesl = plt.axhline(y=.5, xmin=0.25, xmax=0.75)p = plt.axhspan(0.25, 0.75, facecolor='0.5', alpha=0.5)p = plt.axvspan(1.25, 1.55, facecolor='g', alpha=0.5)plt.axis([-1, 2, -1, 2])plt.show()参考:
- http://stackoverflow.com/questions/16162514/how-can-i-move-a-tick-label-onlywithout-moving-corresponding-tick
- http://stackoverflow.com/questions/28615887/how-to-move-a-ticks-label-in-matplotlib
- http://stackoverflow.com/questions/31928209/matplotlib-fixed-spacing-between-left-edge-of-figure-and-y-axis
- http://stackoverflow.com/questions/6406368/matplotlib-move-x-axis-label-downwards-but-not-x-axis-ticks
- http://matplotlib.org/examples/pylab_examples/axhspan_demo.html
【Matplotlib】详解图像各个部分
首先一幅Matplotlib的图像组成部分介绍。
在matplotlib中,整个图像为一个Figure对象。在Figure对象中可以包含一个或者多个Axes对象。每个Axes(ax)对象都是一个拥有自己坐标系统的绘图区域。所属关系如下:
下面以一个直线图来详解图像内部各个组件内容:
其中:title为图像标题,Axis为坐标轴, Label为坐标轴标注,Tick为刻度线,Tick Label为刻度注释。各个对象关系可以梳理成以下内容:
图像中所有对象均来自于Artist的基类。
上面基本介绍清楚了图像中各个部分的基本关系,下面着重讲一下几个部分的详细的设置。
一个"Figure"意味着用户交互的整个窗口。在这个figure中容纳着"subplots"。
当我们调用plot时,matplotlib会调用gca()获取当前的axes绘图区域,而且gca反过来调用gcf()来获得当前的figure。如果figure为空,它会自动调用figure()生成一个figure, 严格的讲,是生成subplots(111)。
Figures
Subplots
plt.subplot(221) # 第一行的左图plt.subplot(222) # 第一行的右图plt.subplot(212) # 第二整行plt.show()注意:其中各个参数也可以用逗号,分隔开。第一个参数代表子图的行数;第二个参数代表该行图像的列数; 第三个参数代表每行的第几个图像。
另外:fig, ax = plt.subplots(2,2),其中参数分别代表子图的行数和列数,一共有 2x2 个图像。函数返回一个figure图像和一个子图ax的array列表。
补充:gridspec命令可以对子图区域划分提供更灵活的配置。
Tick Locators
Tick Locators 控制着 ticks 的位置。比如下面:
ax = plt.gca()ax.xaxis.set_major_locator(eval(locator))一些不同类型的locators:
代码如下:
import numpy as npimport matplotlib.pyplot as pltdef tickline():plt.xlim(0, 10), plt.ylim(-1, 1), plt.yticks([])ax = plt.gca()ax.spines['right'].set_color('none')ax.spines['left'].set_color('none')ax.spines['top'].set_color('none')ax.xaxis.set_ticks_position('bottom')ax.spines['bottom'].set_position(('data',0))ax.yaxis.set_ticks_position('none')ax.xaxis.set_minor_locator(plt.MultipleLocator(0.1))ax.plot(np.arange(11), np.zeros(11))return axlocators = ['plt.NullLocator()','plt.MultipleLocator(1.0)','plt.FixedLocator([0, 2, 8, 9, 10])','plt.IndexLocator(3, 1)','plt.LinearLocator(5)','plt.LogLocator(2, [1.0])','plt.AutoLocator()',]n_locators = len(locators)size = 512, 40 * n_locatorsdpi = 72.0figsize = size[0] / float(dpi), size[1] / float(dpi)fig = plt.figure(figsize=figsize, dpi=dpi)fig.patch.set_alpha(0)for i, locator in enumerate(locators):plt.subplot(n_locators, 1, i + 1)ax = tickline()ax.xaxis.set_major_locator(eval(locator))plt.text(5, 0.3, locator[3:], ha='center')plt.subplots_adjust(bottom=.01, top=.99, left=.01, right=.99)plt.show()所有这些locators均来自于基类matplotlib.ticker.Locator。你可以通过继承该基类创建属于自己的locator样式。同时matplotlib也提供了特殊的日期locator, 位于matplotlib.dates.
【Matplotlib】线设置,坐标显示范围
改变线的颜色和线宽
参考文章:
- controlling line properties
- Line API
线有很多属性你可以设置:线宽,线型,抗锯齿等等;具体请参考matplotlib.lines.Line2D
有以下几种方式可以设置线的属性
使用关键字参数
plt.plot(x, y, linewidth=2.0)使用 Line2D 对象的设置方法。 plot 返回一个 Line2D 对象的列表; line1, line2 = plot(x1, y1, x2, y2)。 下面的代码中我们假定图中仅有一条线以使返回的列表的长度为1。我们使用
line,进行元组展开,来获得列表的首个元素。line, = plt.plot(x, y, '-')line.set_antialiased(False) # 关闭抗锯齿使用 setp() 命令。下面给出的例子使用Matlab样式命令来设置对列表中的线对象设置多种属性。
setp可以作用于对象列表或仅仅一个对象。你可以使用Python关键字的形式或Matlab样式。lines = plt.plot(x1, y1, x2, y2)# use keyword argsplt.setp(lines, color='r', linewidth=2.0)# or MATLAB style string value pairsplt.setp(lines, 'color', 'r', 'linewidth', 2.0)
设置坐标轴范围
参考文档:
- xlim() 命令
- ylim() 命令
下面以 xlim() 为例进行说明:
获取或设置当前图像 x 轴的范围:
xmin, xmax = xlim() # return the current xlimxlim( (xmin, xmax) ) # set the xlim to xmin, xmaxxlim( xmin, xmax ) # set the xlim to xmin, xmax或者可以下面这样:
xlim(xmax=3) # adjust the max leaving min unchangedxlim(xmin=1) # adjust the min leaving max unchanged设置 x-axis limits 会使得 autoscaling 自动关闭,即两者不能同时设置。
以上说明综合举例如下:
import numpy as npimport matplotlib.pyplot as pltplt.figure(figsize=(8, 5), dpi=80)plt.subplot(111)X = np.linspace(-np.pi, np.pi, 256, endpoint=True)S = np.sin(X)C = np.cos(X)plt.plot(X, C, color="blue", linewidth=2.5, linestyle="-")plt.plot(X, S, color="red", linewidth=2.5, linestyle="-")plt.xlim(X.min() * 1.1, X.max() * 1.1)plt.ylim(C.min() * 1.1, C.max() * 1.1)plt.show()生成的图像:
【Matplotlib】 刻度设置(2)
Tick locating and formatting
该模块包括许多类以支持完整的刻度位置和格式的配置。尽管 locators 与主刻度或小刻度没有关系,他们经由 Axis 类使用来支持主刻度和小刻度位置和格式设置。一般情况下,刻度位置和格式均已提供,通常也是最常用的形式。
默认格式
当x轴数据绘制在一个大间隔的一个小的集中区域时,默认的格式将会生效。为了减少刻度标注重叠的可能性,刻度被标注在固定间隔之间的空白区域。比如:
ax.plot(np.arange(2000, 2010), range(10))表现形式如下:
刻度仅标注了 0-9 以及一个间隔 +2e3 。如果不希望这种形式,可以关闭默认格式设置中的间隔标注的使用。
ax.get_xaxis().get_major_formatter().set_useOffset(False)设置 rcParam axes.formatter.useoffset=False 以在全局上关闭,或者设置不同的格式。
刻度位置
Locator 类是所有刻度 Locators 的基类。 locators 负责根据数据的范围自动调整视觉间隔,以及刻度位置的选择。 MultipleLocator 是一种有用的半自动的刻度 Locator。 你可以通过基类进行初始化设置等等。
Locator 子类定义如下:
你可以继承 Locator 定义自己的 locator。 你必须重写 ___call__ 方法,该方法返回位置的序列,你可能也想重写 autoscale 方法以根据数据的范围设置视觉间隔。
如果你想重写默认的locator,使用上面或常用的locator任何一个, 将其传给 x 或 y axis 对象。相关的方法如下:
ax.xaxis.set_major_locator( xmajorLocator )ax.xaxis.set_minor_locator( xminorLocator )ax.yaxis.set_major_locator( ymajorLocator )ax.yaxis.set_minor_locator( yminorLocator )刻度格式
刻度格式由 Formatter 继承来的类控制。 formatter仅仅作用于单个刻度值并且返回轴的字符串。
相关的子类请参考官方文档。
同样也可以通过重写 __all__ 方法来继承 Formatter 基类以设定自己的 formatter。
为了控制主刻度或小刻度标注的格式,使用下面任一方法:
ax.xaxis.set_major_formatter( xmajorFormatter )ax.xaxis.set_minor_formatter( xminorFormatter )ax.yaxis.set_major_formatter( ymajorFormatter )ax.yaxis.set_minor_formatter( yminorFormatter )设置刻度标注
相关文档:
文本相关
set_xticklabels()
set_yticklabels()
原型举例:
set_xticklabels(labels, fontdict=None, minor=False, **kwargs)综合举例(1)如下:
设置指定位置的标注更改为其他的标注:
...plt.xticks([-np.pi, -np.pi/2, 0, np.pi/2, np.pi], [r'$-\pi$', r'$-\pi/2$', r'$0$', r'$+\pi/2$', r'$+\pi$'])plt.yticks([-1, 0, +1], [r'$-1$', r'$0$', r'$+1$'])...综合举例(2)如下:
设置坐标轴主刻度和次刻度。
#!/usr/bin/env python#-*- coding: utf-8 -*- #---------------------------------------------------#演示MatPlotLib中设置坐标轴主刻度标签和次刻度标签.#对于次刻度显示,如果要使用默认设置只要matplotlib.pyplot.minorticks_on()#---------------------------------------------------import numpy as npimport matplotlib.pyplot as pltfrom matplotlib.ticker import MultipleLocator, FormatStrFormatter#---------------------------------------------------xmajorLocator = MultipleLocator(20) #将x主刻度标签设置为20的倍数xmajorFormatter = FormatStrFormatter('%5.1f') #设置x轴标签文本的格式xminorLocator = MultipleLocator(5) #将x轴次刻度标签设置为5的倍数ymajorLocator = MultipleLocator(0.5) #将y轴主刻度标签设置为0.5的倍数ymajorFormatter = FormatStrFormatter('%1.1f') #设置y轴标签文本的格式yminorLocator = MultipleLocator(0.1) #将此y轴次刻度标签设置为0.1的倍数 t = np.arange(0.0, 100.0, 1)s = np.sin(0.1*np.pi*t)*np.exp(-t*0.01)ax = plt.subplot(111) #注意:一般都在ax中设置,不再plot中设置plt.plot(t,s,'--r*')#设置主刻度标签的位置,标签文本的格式ax.xaxis.set_major_locator(xmajorLocator)ax.xaxis.set_major_formatter(xmajorFormatter)ax.yaxis.set_major_locator(ymajorLocator)ax.yaxis.set_major_formatter(ymajorFormatter)#显示次刻度标签的位置,没有标签文本ax.xaxis.set_minor_locator(xminorLocator)ax.yaxis.set_minor_locator(yminorLocator)ax.xaxis.grid(True, which='major') #x坐标轴的网格使用主刻度ax.yaxis.grid(True, which='minor') #y坐标轴的网格使用次刻度plt.show()##########################################################图像形式如下:
【Matplotlib】 增加图例
相关文档:
Legend guide
legend() command
Legend API
控制图例入口
无参调用 legend() 会自动获取图例 handles 以及相关的 labels。其对应于以下代码:
handles, labels = ax.get_legend_handles_labels()ax.legend(handles, labels)get_legend_handles_labels()方法返回 存在于图像中的 handles/artists 列表,这些图像可以用来生成结果图例中的入口。值得注意的是并不是所有的 artists 都可以被添加到图例中。
为了全部控制添加到图例中的内容,通常直接传递适量的 handles 给legend()函数。
line_up, = plt.plot([1,2,3], label='Line 2')line_down, = plt.plot([3,2,1], label='Line 1')plt.legend(handles=[line_up, line_down])某些情况下,不太可能设置 handle 的 label,所以需要传递 labels 的列表给 legend()。
line_up, = plt.plot([1,2,3], label='Line 2')line_down, = plt.plot([3,2,1], label='Line 1')plt.legend([line_up, line_down], ['Line Up', 'Line Down'])综合例子如下:
import numpy as npimport matplotlib.pyplot as pltplt.figure(figsize=(8,5), dpi=80)plt.subplot(111)X = np.linspace(-np.pi, np.pi, 256,endpoint=True)C = np.cos(X)S = np.sin(X)plt.plot(X, C, color="blue", linewidth=2.5, linestyle="-", label="cosine")plt.plot(X, S, color="red", linewidth=2.5, linestyle="-", label="sine")ax = plt.gca()ax.spines['right'].set_color('none')ax.spines['top'].set_color('none')ax.xaxis.set_ticks_position('bottom')ax.spines['bottom'].set_position(('data',0))ax.yaxis.set_ticks_position('left')ax.spines['left'].set_position(('data',0))plt.xlim(X.min() * 1.1, X.max() * 1.1)plt.xticks([-np.pi, -np.pi/2, 0, np.pi/2, np.pi], [r'$-\pi$', r'$-\pi/2$', r'$0$', r'$+\pi/2$', r'$+\pi$'])plt.ylim(C.min() * 1.1, C.max() * 1.1)plt.yticks([-1, +1], [r'$-1$', r'$+1$'])plt.legend(loc='upper left')plt.show()图像表现形式如下:
【Matplotlib】 标注一些点
相关的文档:
Annotating axis
annotate() command
标注的代码如下:
...t = 2 * np.pi / 3plt.plot([t, t], [0, np.cos(t)], color='blue', linewidth=2.5, linestyle="--")plt.scatter([t, ], [np.cos(t), ], 50, color='blue')plt.annotate(r'$sin(\frac{2\pi}{3})=\frac{\sqrt{3}}{2}$', xy=(t, np.sin(t)), xycoords='data', xytext=(+10, +30), textcoords='offset points', fontsize=16, arrowprops=dict(arrowstyle="->", connectionstyle="arc3,rad=.2"))plt.plot([t, t],[0, np.sin(t)], color='red', linewidth=2.5, linestyle="--")plt.scatter([t, ],[np.sin(t), ], 50, color='red')plt.annotate(r'$cos(\frac{2\pi}{3})=-\frac{1}{2}$', xy=(t, np.cos(t)), xycoords='data', xytext=(-90, -50), textcoords='offset points', fontsize=16, arrowprops=dict(arrowstyle="->", connectionstyle="arc3,rad=.2"))...【Matplotlib】 标注细节注意
相关文档:
Artists
BBox
由于蓝线和红线的存在,现在刻度标注很难看清楚。我们可以使他们更大,也可以使它们的属性以便使得线呈现半透明的白色背景。这样做我们既可以看到数据也可以看到刻度标注了。
相关的设置代码:
...for label in ax.get_xticklabels() + ax.get_yticklabels(): label.set_fontsize(16) label.set_bbox(dict(facecolor='white', edgecolor='None', alpha=0.65))...设置前图像:
设置后图像:
完整的代码如下:
import numpy as npimport matplotlib.pyplot as pltplt.figure(figsize=(8, 5), dpi=80)plt.subplot(111)X = np.linspace(-np.pi, np.pi, 256, endpoint=True)C, S = np.cos(X), np.sin(X)plt.plot(X, C, color="blue", linewidth=2.5, linestyle="-", label="cosine")plt.plot(X, S, color="red", linewidth=2.5, linestyle="-", label="sine")ax = plt.gca()ax.spines['right'].set_color('none')ax.spines['top'].set_color('none')ax.xaxis.set_ticks_position('bottom')ax.spines['bottom'].set_position(('data', 0))ax.yaxis.set_ticks_position('left')ax.spines['left'].set_position(('data', 0))plt.xlim(X.min() * 1.1, X.max() * 1.1)plt.xticks([-np.pi, -np.pi / 2, 0, np.pi / 2, np.pi], [r'$-\pi$', r'$-\pi/2$', r'$0$', r'$+\pi/2$', r'$+\pi$'])plt.ylim(C.min() * 1.1, C.max() * 1.1)plt.yticks([-1, 1], [r'$-1$', r'$+1$'])plt.legend(loc='upper left')t = 2*np.pi/3plt.plot([t, t], [0, np.cos(t)], color='blue', linewidth=1.5, linestyle="--")plt.scatter([t, ], [np.cos(t), ], 50, color='blue')plt.annotate(r'$sin(\frac{2\pi}{3})=\frac{\sqrt{3}}{2}$', xy=(t, np.sin(t)), xycoords='data', xytext=(10, 30), textcoords='offset points', fontsize=16, arrowprops=dict(arrowstyle="->", connectionstyle="arc3,rad=.2"))plt.plot([t, t], [0, np.sin(t)], color='red', linewidth=1.5, linestyle="--")plt.scatter([t, ], [np.sin(t), ], 50, color ='red')plt.annotate(r'$cos(\frac{2\pi}{3})=-\frac{1}{2}$', xy=(t, np.cos(t)), xycoords='data', xytext=(-90, -50), textcoords='offset points', fontsize=16, arrowprops=dict(arrowstyle="->", connectionstyle="arc3,rad=.2"))for label in ax.get_xticklabels() + ax.get_yticklabels(): label.set_fontsize(16) label.set_bbox(dict(facecolor='white', edgecolor='None', alpha=0.65 ))plt.show()- matplotlib的一些基本设置的记录
- matplotlib的基本用法(二)——设置坐标轴
- matplotlib的基本用法(四)——设置legend图例
- matplotlib的基本用法(六)——设置坐标轴label
- Matplotlib的中文设置
- Fedora的一些基本设置
- IAR的一些基本设置
- Highcharts的一些基本设置
- 记录一下matplotlib的使用。
- 有关Matplotlib的一些技巧
- 记录@property的一些常用设置
- 窗体设置的一些基本属性(一部分)
- android stuio的一些基本设置
- Ubuntu下MySQL的一些基本设置
- Winform中DevExpress的一些基本设置
- Android Studio的一些基本设置
- linux的基本语法及一些设置
- python3 matplotlib和seaborn的使用记录
- 关于设计模式的几点经验分享
- 前端开发 将table内容导出到excel
- 【bzoj3389】[Usaco2004 Dec]Cleaning Shifts安排值班
- 5.5
- 程序执行概述
- matplotlib的一些基本设置的记录
- Retrofit2源码解析03-OkHttpCall.enqueue
- JVM每小时执行一次FULL GC问题
- 在eclipse中配置tomcat
- Spring 自动装配Bean属性
- 《白话深度学习与Tensorflow》学习笔记(2)梯度下降、梯度消失、参数、归一化
- 自定义View排列
- 【Java面试题】spring+springMVC+mybatis原理及实现机制(持续更新)
- Luogu P1794 装备运输