Debugging with RStudio
来源:互联网 发布:土豆for mac 编辑:程序博客网 时间:2024/06/07 13:06
- Introduction
- Entering debug mode (stopping)
- Stopping on a line
- Stopping when a function executes
- Stopping when an error occurs
- Using the debugger
- Environment pane
- Code window
- Console
- Debugging commands
- Special circumstances
- Debugging outside functions
- Debugging in packages
- Debugging in Shiny applications
- Debugging in R Markdown documents
- Further Reading
Introduction
Debugging in R is a broad topic. In this article, we focus specifically on the R debugging tools built into RStudio; for more general advice on debugging in R (such as philosophy and problem-solving strategies), we recommend this resource from Hadley Wickham:
Debugging, condition handling, and defensive programming
In a very general sense, debugging is designed to help you find bugs by figuring out where the code is not behaving in the way that you expect. To do this, you need to:
- Begin running the code
- Stop the code at the point where you suspect the problem is arising, and
- Look at and/or walk through the code, step-by-step at that point.
We’ll look at these last two tasks in detail.
Entering debug mode (stopping)
In order to enter debug mode, you’ll need to tell R when you want to pause the computation. R doesn’t have a “pause now” feature (and most computations are so fast that such a feature would not be helpful!). Instead, you’ll want to “set your traps” prior to starting your computation.
There are several ways to do this; pick one that corresponds best to your problem.
Stopping on a line
Editor breakpoints
The most common (and easiest) way to stop on a line of code is to set a breakpoint on that line. You can do this in RStudio by clicking to the left of the line number in the editor, or by pressing Shift+F9 with your cursor on the desired line.
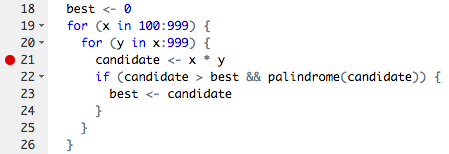
We call this an “editor breakpoint”. Editor breakpoints take effect immediately and don’t require you to change your code (unlike browser() breakpoints, below).
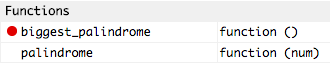
Editor breakpoints work by injecting some tracing code into the R function object. R function objects that include this tracing code have a red dot in the environment pane, indicating that they contain breakpoints.
If the function object doesn’t exist yet (for instance, because you haven’t called source() on the file), or the function object doesn’t match the contents of the editor (for instance, because you’ve changed the file since the last source()), the breakpoint will be deferred.
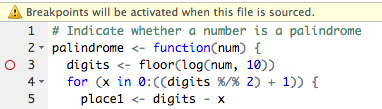
The circle outline indicates that RStudio is aware of the breakpoint, but that it hasn’t been injected. In most cases, you can source() the file to resolve the problem.
browser() breakpoints
The R function browser() halts execution and invokes an environment browser when it is called. You can put browser() anywhere in your code to stop at that point in the code for debugging. Here, for instance, it’s used to halt when a function is about to return TRUE:

Unlike an editor breakpoint, the browser() statement is actually part of your code, so it needs to be applied like any other code change in order to become active (by sourcing the containing document, rebuilding the containing package, reloading the Shiny application, etc.).
The environment browser invoked by browser() is the same one used in all of the other debugging facilities, so it can be considered the lowest-level debugging tool. Because the browser() statement requires no special tooling, it can be used in contexts where editor breakpoints won’t work.
browser() is also useful for creating conditional breakpoints. For instance, if you want to start debugging after hundreds of loop iterations:
for (i in 1:1024) { start_work() if (i == 512) browser() finish_work()}Stopping when a function executes
If you have the .R file corresponding to the code you want to debug, it’s easy to use editor breakpoints or browser() to add breakpoints to it. Sometimes, however, you don’t have the source file for the code you want to debug.
When this is the case, you can set a debug flag on the function you want to debug. You can think of this as setting a breakpoint before the very first statement in a function; it does not change the function itself, but it causes the debugger to activate immediately when the function is run.
Use the R function debugonce() to set the debug flag on a function. For instance, if you want to debug devtools::install():
> debugonce(devtools::install)debugonce() sets a one-shot breakpoint–that is, the function will enter the debugger the very next time it runs, but not after that. If you want to debug a function every time it executes, call debug(...) on the function. Call undebug(...) on the function when you no longer want to debug the function each time it executes. We don’t recommend this pattern, since it can leave you trapped in the debugger for some special functions.
Stopping when an error occurs
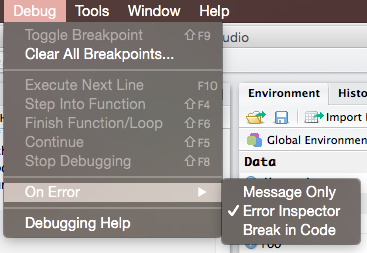
If you’re diagnosing a specific error, you can have RStudio halt execution at the point where the error is raised. To do this, go to Debug -> On Error and change the value from “Error Inspector” to “Break in Code”.
To keep the the debugger from being invoked whenever any error anywhere happens, RStudio does not invoke the debugger if it looks like none of your own code is on the stack. If you find that this is excluding an error you want to catch, go to Tools -> Global Options and uncheck “Use debug error handler only when my code contains errors”.
If you really want to invoke the debugger on every error, always, this will do the job:
> options(error = browser())This overrides RStudio’s error handler settings. Trapping every error will quickly become annoying, though, so be sure to use the Debug menu to change the error option back when you’re done troubleshooting (or turn off error handling entirely with options(error = NULL)
Using the debugger
Once your code is stopped, the IDE will automatically enter debug mode, in which a variety of tools for inspecting and altering the state of your program become available. We’ll look at each in turn.

Environment pane
Usually in R you’re interacting with the “global environment”, a list of named objects such as values, functions, and data. When you enter debug mode, the IDE begins viewing and interacting with the currently executing function’s environment instead. That means that the objects you see in the Environment pane belong to the currently executing function, and statements you enter in the Console will be evaluated in the context of the function.

The gray values are promises–in this case, function arguments that haven’t been evaluated yet.
Above the list of local objects in the Environment pane is a drop-list that shows you the “environment stack”. This shows you the inheritance chain for the active environment–that is, the list of places that will be searched to resolve variable names to values.

Most of the time it will include just the current function, the global environment, and some package namespaces, but if you’re writing a package or nesting functions, it’ll have additional entries. You can click any item in the droplist to see the contents of the corresponding environment.
If this all sounds confusing, don’t worry–most of the time you won’t need to dive into the environment stack! If you want to understand what’s going on under the covers, see Environments for a detailed look at how environments and inheritance work.
Traceback (Callstack)
The traceback shares space with the environment pane. It shows you how execution reached the current point, from the first function that was run (at the bottom) to the function that is running now (at the top).

This is called the “call stack” in most languages; RStudio refers to it as the “traceback” for symmetry with the R command traceback().
You can click on any function in the callstack to see the current contents of its environment and the execution point in the function’s code, if it can be determined. Note that selecting a frame in the callstack does not change the active environment in the console! If you need to do that, use recover() (described below).
Most of the time you’ll only be interested in looking at the portions of the callstack that contain your own code, so by default RStudio hides internal functions (i.e. those for which it does not have a corresponding .R file) in the callstack to keep it from becoming too verbose. The View Internals checkbox can be toggled to show or hide internal functions in the callstack. For instance, inside a tryCatch block, you can expand the internals to see R’s exception handling functions (shown in gray):

Code window
The code window shows you the currently executing function. The line about to execute is highlighted in yellow.

If RStudio can’t find a .R file that matches the function, it will show the code in the Source Viewer. This can happen either because no .R file exists or because the function object doesn’t match the definition in the .R file.

Console
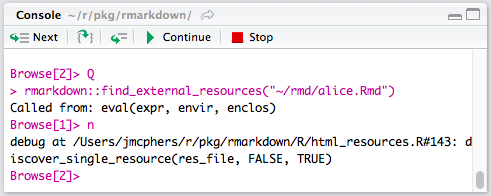
While debugging, you’ll notice two changes to the R console. The first is that the prompt is different:
Browse[1]> This prompt indicates that you’re inside the R environment browser.
The R console while debugging supports all the same commands as the ordinary console, with a few differences:
- Statements are evaluated in the current environment–that is, if your function has a variable named
x, typingxat the prompt will show you the value of that variable. (Tryls()at the prompt to see all the variables). - Simply pressing Enter at the console will execute the current statement and move on to the next one. This is a convenient way to step through statements quickly.
- A variety of special debugging commands are available (described below)
If you want to interact with a different function’s environment at the console, use recover() to display a list of running functions, from which you can select.
The second is that there’s a new toolbar on top of the console:

This toolbar provides convenient buttons that send the special debug control commands (see table below) to the R console. There’s no difference between using the toolbar and entering the commands at the console directly, so it’s helpful to learn the command shortcuts if you spend much time debugging.
Debugging commands
All of these commands are documented in the R help page for browser(); you can also type help at the Browse[N]> prompt to see them.
Special circumstances
Most of the time you’ll likely be debugging in straightforward, free-standing R functions and scripts. However, some special circumstances arise when debugging R code that’s part of a larger project; here are four that require some special mention:
Debugging outside functions
You might have noticed earlier that RStudio (and R itself, via setBreakpoint()) creates breakpoints by modifying the function in which a breakpoint is set. What happens when you set a breakpoint outside a function?
The most common use case here is halting during execution of a source() command, to examine the state during execution of an R script. R’s built-in source() command doesn’t have a way to do this, but RStudio includes its own version of source() called debugSource() that does. This version is able to halt at the breakpoints RStudio knows about.
Consequently, if a file contains breakpoints outside functions, you’ll need to call debugSource() in place of source() on that file. RStudio does this for you automatically when the file contains breakpoints and you use the RStudio Source command to source your script.
It’s important to note that debugSource is not recursive. This implies that if you call source("file1.R") inside file2.R, then execute the whole thing with debugSource("file2.R"), you’ll hit breakpoints in file2.R, but not file1.R. We generally recommend that you isolate code for debugging, but if you need to work this way, you can call debugSourcemanually inside your R script.
Debugging in packages
Breakpoints can be set in package code just as they can in free-standing R code. The primary difference is that you’ll need to have an up-to-date build of your package in order to set breakpoints. If your package build isn’t up to date, RStudio will warn you when you try to set a breakpoint.
In order to debug effectively in your package, you’ll also want to ensure that your package is compiled with the --with-keep.source option. This option is the default for new packages in RStudio; if you need to set it manually, it can be found in Tools -> Project Options -> Build Tools.

When a breakpoint is set in a file inside a package, RStudio will automatically disable the breakpoint when the package is unloaded and enable the breakpoint when the package is loaded. If you’re having trouble setting breakpoints in a package, make sure that the package was compiled with source information as described above and that its build is up-to-date.
Debugging in Shiny applications
Shiny applications present some challenges for the debugger because the breakpoints can’t be set until the application is executed; the function objects that need to have breakpoints injected don’t exist until then.
For this reason, breakpoints in Shiny applications only work inside the shinyServer function. Breakpoints are not currently supported in the user interface (i.e. ui.R), globals (i.e. global.R), or other .R sources used in Shiny applcations. This may be improved in a future version of RStudio.

Finally, be aware that Shiny’s infrastructure will show up in the callstack, and there’s quite a lot of it before control reaches your code!
Debugging in R Markdown documents
Breakpoints don’t currently work inside R chunks in R Markdown documents, so you’ll need to use browser() to halt execution in a chunk if needed.
By default, RStudio renders R Markdown documents using a separate R process when you click the Knit button. This has many benefits; it keeps the document reproducible by isolating it from your current session’s state, and it keeps the UI and console responsive while the document renders. However, debugging only works with the primary R process, so when rendering the document for debugging, you’ll need to ensure it renders there.
To do this, call rmarkdown::render() directly on your file:
> rmarkdown::render("~/mydocs/doc.Rmd") Finally, because R Markdown chunks don’t contain source references, most of the debugger’s visual features are disabled; you won’t see the active line highlighting in the editor and most debugging will need to be done in the console.
Further Reading
Introduction to Debugging in R (video, about 11 minutes)
R function documentation: browser(), debug(), debugonce(), options(error = …), recover(), setBreakpoint(), traceback().
Debugging, condition handling, and defensive programming by Hadley Wickham
Source References (R Journal article), by Duncan Murdoch
- Debugging with RStudio
- Visual debugging with RStudio
- Debugging with RStudio
- Profiling with RStudio and profvis
- Remote Debugging with Eclipse
- Debugging with Smack
- Debugging with GDB
- Remote Debugging with Eclipse
- Debugging with GDB
- Debugging with Symbols
- Remote Debugging with Eclipse
- Debugging with GDB
- Debugging with gdb
- Debugging with GDB
- Debugging with GDB
- Java Debugging with Eclipse
- Debugging with GDB
- 《Debugging with GDB》
- Mybatis------ @Resource注解出现错误
- 浮点数的二进制表示学习笔记
- Java--启动Tomcat报错:Server Tomcat v7.0 Server at localhost failed to start.
- 使用HTML5 File API 在浏览器中实现本地与远程桌面间传递文件
- c#list,Dictionary,Queue,Stack
- Debugging with RStudio
- glide简单使用笔记
- 传统IT七大职业的云计算转型之路
- 【NOIP2017提高组】好路线
- GAN 学习 (1)
- 机器学习中的偏差与方差
- 如何给元素添加事件监听和取消事件冒泡
- Spring MVC AOP通过自定义注解方式拦截Controller等实现日志管理
- 001-Java杂记之二分查找