ELK logstash01 初步体验
来源:互联网 发布:php eduwind 编辑:程序博客网 时间:2024/05/16 11:44
1 Getting Started with Logstash
1.1 down & install
https://www.elastic.co/cn/downloads/logstash
unzip
Conf: logstash.conf
input { stdin { } }output { stdout { codec => rubydebug }}Run:
bin/logstash -f logstash.conf...Successfully started Logstash API endpoint {:port=>9600}...test:
hello shaoling{ "@version" => "1", "host" => "sl", "@timestamp" => 2017-11-08T05:46:38.728Z, "message" => "hello shaoling"}If no codec => rubydebug,result as:
hello2017-11-08T05:49:43.831Z sl helloRef: https://www.elastic.co/guide/en/logstash/current/getting-started-with-logstash.html
1.2 Stashing Your First Event
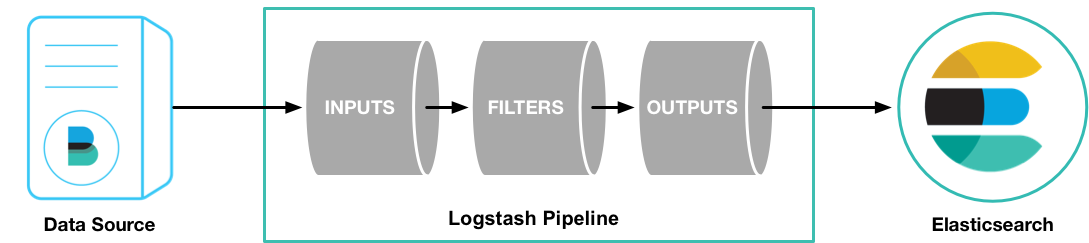
Logstash pipeline:
- required elements: input and output
- one optional ele: filter.
$ bin/logstash --help$ bin/logstash -e 'input { stdin { } } output { stdout {} }'exit: CTRL-DThe -e flag, enables you to specify a configuration directly from the command line.
1.3 Parsing Logs with Logstash
Real world:
one or more input, filter, and output plugins正则:
- * , 0+ ,
- + , 1+
- ? , 0 or 1
1.3.1 Issue
create a Logstash pipeline that uses Filebeat to take Apache web logs as input, parses those logs to create specific, named fields from the logs, and writes the parsed data to an Elasticsearch cluster.
1.3.1.1 Filebeat down..install:
Conf: filebeat.yml
Run: sudo ./filebeat -e -c filebeat.yml
Ref: https://www.elastic.co/guide/en/beats/filebeat/current/filebeat-getting-started.html
Filebeat provides a set of pre-built modules that you can use to rapidly implement and deploy a log monitoring solution, complete with sample dashboards and data visualizations, in about 5 minutes. These modules support common log formats, such as Nginx, Apache2, and MySQL, and can be run by issuing a simple command.
已支持的 modules: Apache2/MySQL/Nginx/System/Dev…
https://www.elastic.co/guide/en/beats/filebeat/current/filebeat-modules.html
running filebeat with modules enabled:
./filebeat -e -modules=MODULES(逗号分多个) -setup./filebeat -e -modules=system,nginx,mysql -setup-e 命令行配置,生产环境需要配置文件
配置:filebeat.yml
https://www.elastic.co/guide/en/beats/libbeat/5.6/config-file-format.html
To configure Filebeat:
1. Define the path (or paths) to your log files.
filebeat.prospectors:- input_type: log paths: - /var/log/*.logFilebeat will harvest all files in the directory /var/log/ that end with .log
Golang Glob
/var/log//.log. This fetches all .log files from the subfolders of /var/log,not fetch log files from the /var/log folder itself.
send output
- to ES:
output.elasticsearch: hosts: ["192.168.1.42:9200"]- to Logstash:
output.logstash: hosts: ["127.0.0.1:5044"]
test conf:
./filebeat -configtest -eConfiguring Template Loading
output.elasticsearch: hosts: ["localhost:9200"] template.name: "filebeat" template.path: "filebeat.template.json" template.overwrite: falseTo disable automatic template loading, comment out the template part under the Elasticsearch output.
1.3.1.2 conf logstash
- configure Filebeat to send log lines to Logstash . lightweight, resource-friendly tool,designed for reliability and low latency, light resource footprint,
- In a typical use case, Filebeat runs on a separate machine from …logstash…
- create the Logstash pipeline
- 默认包含 Beats input plugin,enables Logstash to receive events from the Elastic Beats framework(Packetbeat,Metricbeat)
input { beats { port => "5043" }}input { beats { port => "5043" }}output { stdout { codec => rubydebug }}bin/logstash -f first-pipeline.conf --config.test_and_exitbin/logstash -f first-pipeline.conf --config.reload.automatic1.3.2 grok filter
parse the unstructured log data into something structured and queryable.
%{COMBINEDAPACHELOG} , combinedapachelog
Grok Debugger
https://www.elastic.co/guide/en/kibana/5.6/xpack-grokdebugger.html
filter { grok { match => { "message" => "%{COMBINEDAPACHELOG}"} }}force Filebeat to read the log file from scratch,shut down Filebeat, then delete the Filebeat registry file.
sudo rm data/registryNext, restart Filebeat
sudo ./filebeat -e -c filebeat.yml -d “publish”
1.3.3 geoip Plugin:
looks up IP addresses, derives geographic location information from the addresses, and adds that location information to the logs.
geoip { source => "clientip"}The geoip plugin configuration requires you to specify the name of the source field that contains the IP address to look up.
Since filters are evaluated in sequence, make sure that the geoip section is after the grok.
input { beats { port => "5043" }} filter { grok { match => { "message" => "%{COMBINEDAPACHELOG}"} } geoip { source => "clientip" }}output { stdout { codec => rubydebug }}to ES:
output { elasticsearch { hosts => [ "localhost:9200" ] }}- ELK logstash01 初步体验
- ELK:环境搭建&初体验
- ELK日志分析系统初体验
- SWT初步体验
- Maven 2 初步体验
- 初步体验CSDN
- wxWidgets初步体验
- 初步体验Hibernate
- Hibernate的初步体验。
- 初步体验libsvm用法
- 初步体验libsvm用法
- pymedia初步体验
- Windows 10 初步体验
- LXC初步体验
- Swift初步体验
- AndroidTest Espresso初步体验
- fis3初步学习体验
- Yeelink初步体验
- android清除缓存,查看缓存
- 实时监控、直播流、流媒体、视频网站开发方案流媒体服务器搭建及配置详解:使用nginx搭建rtmp直播、rtmp点播、,hls直播服务配置详解
- poj2828-Buy Tickets(线段树,单点更新)
- ConstraintLayout约束布局
- 内部类存在的意义
- ELK logstash01 初步体验
- 遇见大数据可视化 : 那些 WOW 的数据可视化案例
- 【观察】与版权方合作 ,走上“正轨“的迅雷以后可以说什么样的故事?
- android 弹出窗口
- cut指令
- 欢迎使用CSDN-markdown编辑器
- javascript学习心得1
- Session
- 学习回顾mysql常用函数(2)