leaflet + echart 图表展示信息
来源:互联网 发布:网络电玩城24小时下分 编辑:程序博客网 时间:2024/06/05 18:31
本文转账出处:7.结合echart图表展示信息
本文主要介绍leaflet采用echart以图表方式在地图中进行信息展示的三种方法,包括 popup、Control形式及Marker方式。具体如下:
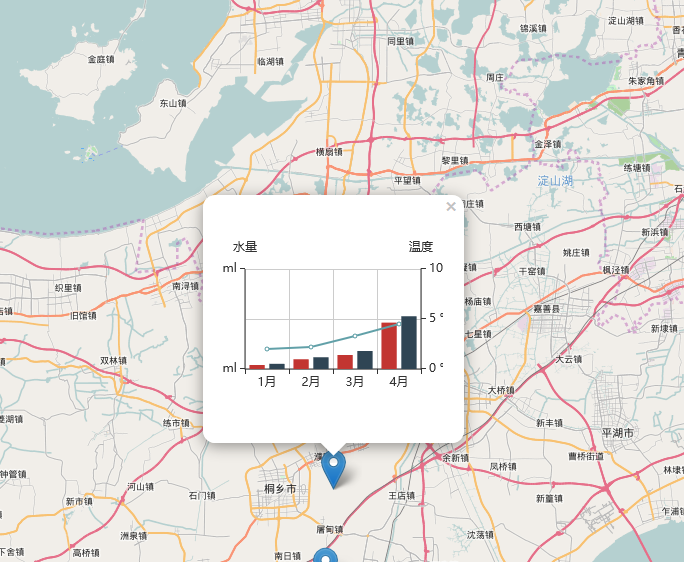
1.popup中添加图表信息

                  //定义marker
                  var marker = L.marker(val.location).addTo(map);                  var content = '<div style="width: 220px; height: 220px;" id="marker' + val.id + '"></div>';                  marker.bindPopup(content, {});                  marker.on('popupopen', function(e) {                      // 基于准备好的dom,初始化echarts实例                      var myChart = echarts.init(document.getElementById('marker' + val.id));                      // 指定图表的配置项和数据                      option = {                          tooltip: {                              trigger: 'axis'                          },                          xAxis: [{                              type: 'category',                              data: ['1月', '2月', '3月', '4月']                          }],                          yAxis: [{                              type: 'value',                              name: '水量',                              min: 0,                              max: 50,                              interval: 50,                              axisLabel: {                                  formatter: '{value} ml'                              }                          }, {                              type: 'value',                              name: '温度',                              min: 0,                              max: 10,                              interval: 5,                              axisLabel: {                                  formatter: '{value} °C'                              }                          }],                          series: [{                              name: '蒸发量',                              type: 'bar',                              data: [2.0, 4.9, 7.0, 23.2]                          }, {                              name: '降水量',                              type: 'bar',                              data: [2.6, 5.9, 9.0, 26.4]                          }, {                              name: '平均温度',                              type: 'line',                              yAxisIndex: 1,                              data: [2.0, 2.2, 3.3, 4.5]                          }]                      };                      // 使用刚指定的配置项和数据显示图表。                      myChart.setOption(option);                  });
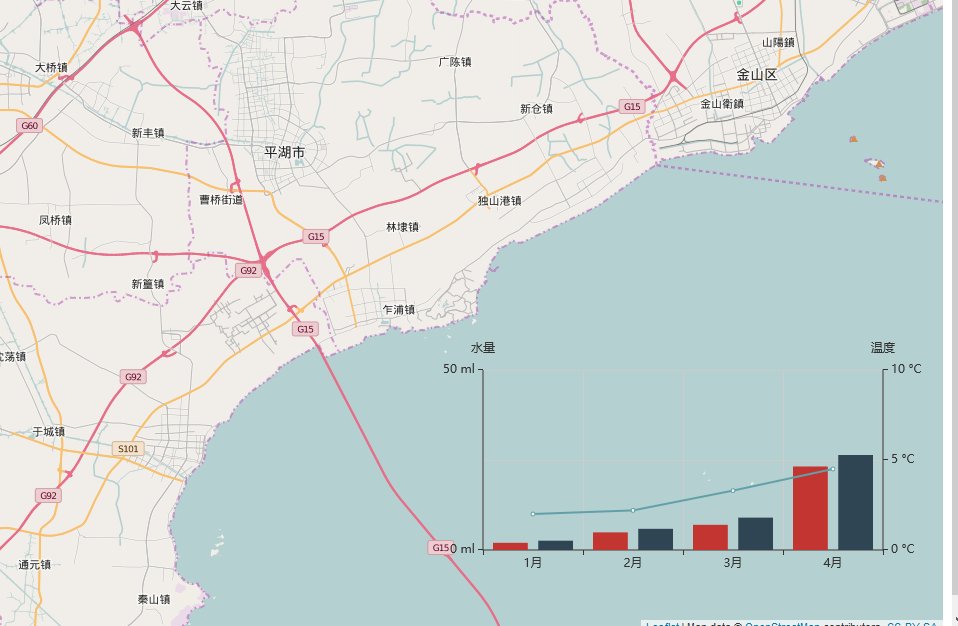
2.echat以控件形式添加在map中
.chart { width: 500px; height: 300px; background-color: white;}
1 var chart = L.control({position: 'bottomright'}); 2 chart.onAdd = function (map) { 3 var div = L.DomUtil.create('div', 'info chart'); 4 div.id="chatrdemo"; 5 return div; 6 }; 7 chart.addTo(map); 8 // 基于准备好的dom,初始化echarts实例 9 var myChart = echarts.init(document.getElementById('chatrdemo'));10 // 指定图表的配置项和数据11 option = {12 tooltip: {13 trigger: 'axis'14 },15 xAxis: [{16 type: 'category',17 data: ['1月', '2月', '3月', '4月']18 }],19 yAxis: [{20 type: 'value',21 name: '水量',22 min: 0,23 max: 50,24 interval: 50,25 axisLabel: {26 formatter: '{value} ml'27 }28 }, {29 type: 'value',30 name: '温度',31 min: 0,32 max: 10,33 interval: 5,34 axisLabel: {35 formatter: '{value} °C'36 }37 }],38 series: [{39 name: '蒸发量',40 type: 'bar',41 data: [2.0, 4.9, 7.0, 23.2]42 }, {43 name: '降水量',44 type: 'bar',45 data: [2.6, 5.9, 9.0, 26.4]46 }, {47 name: '平均温度',48 type: 'line',49 yAxisIndex: 1,50 data: [2.0, 2.2, 3.3, 4.5]51 }]52 };53 54 // 使用刚指定的配置项和数据显示图表。55 myChart.setOption(option);
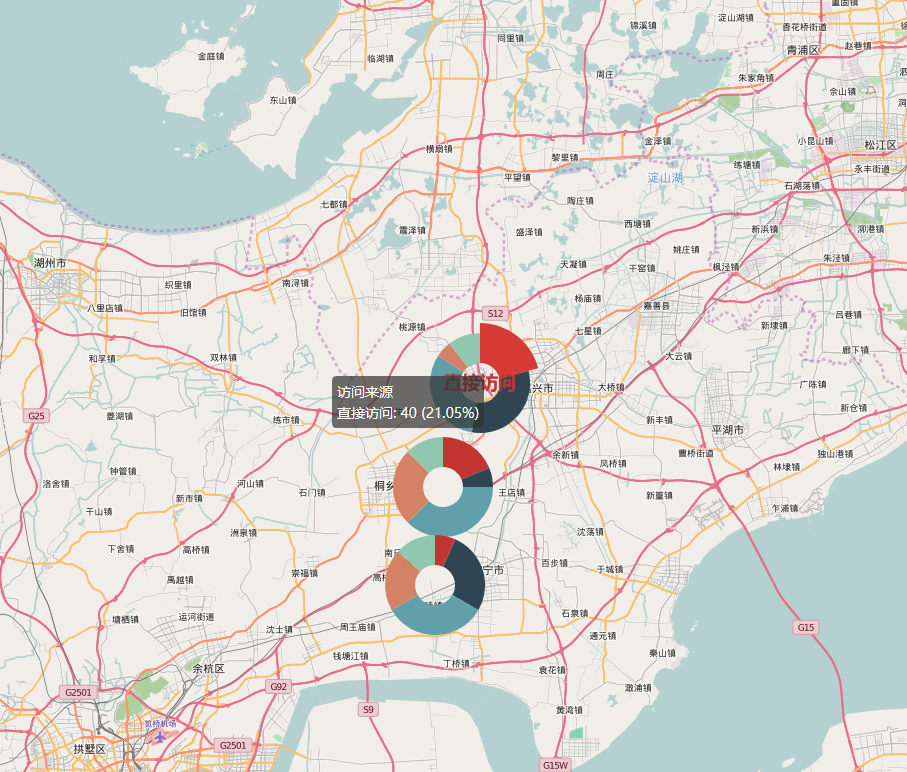
3.以marker形式添加在map
var pictures = L.marker(val.location, { icon: L.divIcon({ className: 'leaflet-echart-icon', iconSize: [160, 160], html: '<div id="marker' + val.id + '" style="width: 160px; height: 160px; position: relative; background-color: transparent;">asd</div>' }) }).addTo(map); // 基于准备好的dom,初始化echarts实例 var myChart = echarts.init(document.getElementById('marker' + val.id)); // 指定图表的配置项和数据 option = { tooltip: { trigger: 'item', formatter: "{a} <br/>{b}: {c} ({d}%)" }, series: [{ name: '访问来源', type: 'pie', radius: ['20', '50'], avoidLabelOverlap: false, label: { normal: { show: false, position: 'center' }, emphasis: { show: true, textStyle: { fontSize: '18', fontWeight: 'bold' } } }, labelLine: { normal: { show: false } }, data: [{ value: val.value1, name: '直接访问' }, { value: val.value2, name: '邮件营销' }, { value: val.value3, name: '联盟广告' }, { value: val.value4, name: '视频广告' }, { value: 20, name: '搜索引擎' }] }] }; // 使用刚指定的配置项和数据显示图表。 myChart.setOption(option);
阅读全文
0 0
- leaflet + echart 图表展示信息
- echart展示图表
- 前端Echart图表展示
- 【数据抓取】EChart图表展示
- Echart获取mysql表实现图表展示
- android平台上展示图表信息
- 选择合适的图表,展示数据信息
- echart 图表显示技术
- echart动态图表
- Android加载echart图表
- echart 图表问题
- echart图表制作bug
- echart 使用jsp展示
- 图表展示
- Echart实现从数据库获取数据展示图表(结合Servlet和SSM实现的两种实例)
- 简单的echart图表实现
- echart chart morisjs 图表重叠
- echart图表拉杆的配置
- APP反编译工具
- c# 随机数重复问题
- 【arduino】蓝牙模块学习(2)两蓝牙模块连接
- Ubuntu14配置Bonding多网卡
- RestTemplate 引起的 "enq: TX
- leaflet + echart 图表展示信息
- 利用RNN对字符串进行预测(31)---《深度学习》
- 11.27--Hibernate延迟加载
- Java 8 lambda表达式示例
- java数据类型对应数据库类型
- ExpandableListView删除子view,子view中的size为0时删除父view
- Intellij IDEA快捷键
- element指定表格某个单元格颜色
- Glide的缓存机制