arcgis api for js之echarts开源js库实现地图统计图分析
来源:互联网 发布:情感计算 知乎 编辑:程序博客网 时间:2024/06/11 10:15
前面写过一篇关于arcgis api for js实现地图统计图的,具体见:http://www.cnblogs.com/giserhome/p/6727593.html
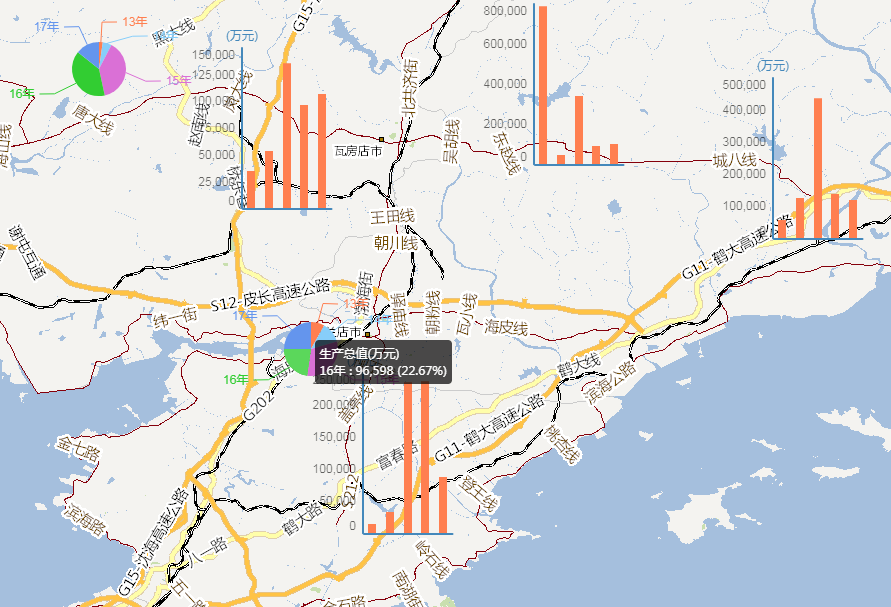
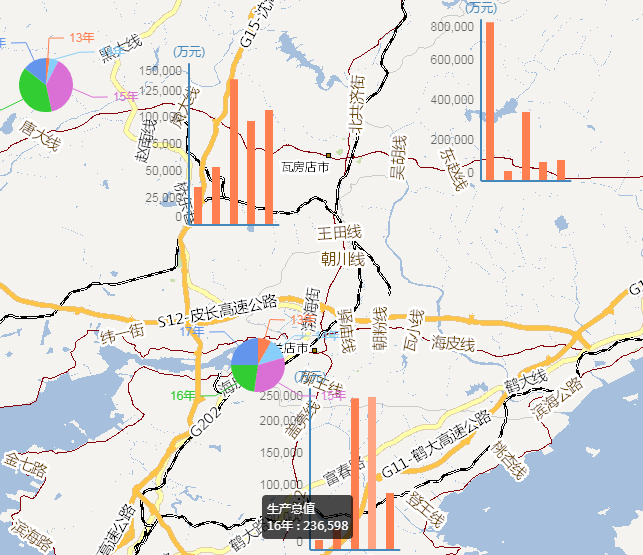
那是基于dojo组件来实现图表统计的,实现的效果一般般;所以,本篇利用arcgis api for js结合echarts实现统计图效果,效果比之前好看,效果图如下:
实现的思路如下:
1.自定义气泡窗口ChartInfoWindow,继承InfoWindowBase,为了echarts统计图表展示在自定义的气泡窗口里面;自定义气泡窗口ChartInfoWindow是为了适应地图上同时展示多个图表,地图默认的气泡窗口只能显示一个,不能同时显示多个的;
2.定义ChartInfoWindow的样式,具体样式如下:
.myInfoWindow { position: absolute; z-index: 100; -moz-box-shadow: 0 0 1em #26393D; font-family: sans-serif; font-size: 12px; background-color: rgba(255, 255, 255, 0);}/*.dj_ie .myInfoWindow {*/ /*border: 1px solid rgba(255, 255, 255, 0);*//*}*/.myInfoWindow .content { position: relative; color:#002F2F; overflow: auto; padding:2px 2px 2px 2px; background-color: rgba(255, 255, 255, 0); }
3.构造模拟数据:
//echarts统计图表模拟数据 jsonBarData: [ { GDP1: 13414, GDP2: 32684, GDP3: 235687, GDP4: 236598, GDP5: 86549, UNIT: "万元", x: 121.988, y: 39.094 }, { GDP1: 34514, GDP2: 52684, GDP3: 135687, GDP4: 96598, GDP5: 106549, UNIT: "万元", x: 121.844, y: 39.481 }, { GDP1: 789014, GDP2: 42684, GDP3: 335687, GDP4: 86598, GDP5: 96549, UNIT: "万元", x: 122.191, y: 39.533 }, { GDP1: 56414, GDP2: 122684, GDP3: 435687, GDP4: 136598, GDP5: 116549, UNIT: "万元", x: 122.476, y: 39.445 }, { GDP1: 23414, GDP2: 92684, GDP3: 535687, GDP4: 436598, GDP5: 76549, UNIT: "万元", x: 122.651, y: 39.979 } ], jsonPieData: [ { GDP1: 89414, GDP2: 82684, GDP3: 635687, GDP4: 536598, GDP5: 66549, UNIT: "万元", x: 121.639, y: 39.563 }, { GDP1: 111414, GDP2: 62684, GDP3: 735687, GDP4: 636598, GDP5: 126549, UNIT: "万元", x: 121.891, y: 39.229 }, { GDP1: 23614, GDP2: 72684, GDP3: 835687, GDP4: 736598, GDP5: 136549, UNIT: "万元", x: 122.211, y: 39.813 }, { GDP1: 93414, GDP2: 132684, GDP3: 935687, GDP4: 126598, GDP5: 146549, UNIT: "万元", x: 122.614, y: 39.652 }, { GDP1: 63414, GDP2: 222684, GDP3: 145687, GDP4: 116598, GDP5: 156549, UNIT: "万元", x: 123.144, y: 39.865 } ],
4.创建柱状图以及饼状图部分代码:
loadChartBarOnMap: function (map, width, height) { require([ "esri/geometry/Point", //添加自定义类型的引用 "CustomModules/ChartInfoWindow", "dojo/_base/array", "dojo/dom-construct", "dojo/_base/window", "dojo/domReady!" ], function ( Point, ChartInfoWindow, array, domConstruct, win ) { for (var i = 0; i < DCI.chart.jsonBarData.length; i++) { var chartData = null; chartData = []; var nodeChart = null; nodeChart = domConstruct.create("div", { id: "nodeTestBar" + i, style: "width:" + width + "px;height:" + height + "px;" }, win.body()); var myChart = echarts.init(document.getElementById("nodeTestBar" + i)); //柱状图 var option = { tooltip: { show: true }, grid: {*/ x: '40%', x2: '1%', y: '10%', y2: '1%', borderWidth: '0'//网格边框 }, xAxis: [ { type: 'category', splitLine: { show: false, },//网格线 data: ["13年", "14年", "15年", "16年", "17年"], axisLabel: {//颜色字体 show: true, //rotate:30, textStyle: { color: 'rgba(0,0,0,0.6)' } }, axisTick: {//x轴刻度 show: false } } ], yAxis: [ { type: 'value', splitLine: { show: false, },//网格线 name: '(万元)', axisLabel: {//颜色字体 show: true, textStyle: { color: 'rgba(0,0,0,0.6)' } } } ], series: [ { "name": "生产总值", "type": "bar", "barWidth": 8, //itemStyle: {normal: {color: '#2466c9'}},//设置颜色 "data": [DCI.chart.jsonBarData[i].GDP1, DCI.chart.jsonBarData[i].GDP2, DCI.chart.jsonBarData[i].GDP3, DCI.chart.jsonBarData[i].GDP4, DCI.chart.jsonBarData[i].GDP5] } ] }; // 为echarts对象加载数据 myChart.setOption(option); var chartPoint = null; chartPoint = new Point(DCI.chart.jsonBarData[i].x, DCI.chart.jsonBarData[i].y, MapConfig.mapInitParams.spatialReference); var chartInfo = new ChartInfoWindow({ map: map, chart: nodeChart, chartPoint: chartPoint, width: width+30, height: height+25 }); } }); }, loadChartPieOnMap: function (map, width, height) { require([ "esri/geometry/Point", //添加自定义类型的引用 "CustomModules/ChartInfoWindow", "dojo/_base/array", "dojo/dom-construct", "dojo/_base/window", "dojo/domReady!" ], function ( Point, ChartInfoWindow, array, domConstruct, win ) { for (var i = 0; i < DCI.chart.jsonPieData.length; i++) { var chartData = null; chartData = []; var nodeChart = null; nodeChart = domConstruct.create("div", { id: "nodeTestPie" + i, style: "width:" + width + "px;height:" + height + "px;" }, win.body()); var myChart = echarts.init(document.getElementById("nodeTestPie" + i)); //饼状图 option = { tooltip: { trigger: 'item', z: 999, formatter: "{a}(万元) <br/>{b} : {c} ({d}%)" }, calculable: false, series: [ { name: "生产总值", type: "pie", radius: "30%", center: ["50%", "60%"], data: [ { value: DCI.chart.jsonBarData[i].GDP1, name: "13年" }, { value: DCI.chart.jsonBarData[i].GDP2, name: "14年" }, { value: DCI.chart.jsonBarData[i].GDP3, name: "15年" }, { value: DCI.chart.jsonBarData[i].GDP4, name: "16年" }, { value: DCI.chart.jsonBarData[i].GDP5, name: "17年" } ] } ] }; // 为echarts对象加载数据 myChart.setOption(option); var chartPoint = null; chartPoint = new Point(DCI.chart.jsonPieData[i].x, DCI.chart.jsonPieData[i].y, MapConfig.mapInitParams.spatialReference); var chartInfo = new ChartInfoWindow({ map: map, chart: nodeChart, chartPoint: chartPoint, width: width+5, height: height+25 }); } }); },
备注:团队承接webgis/gis毕业设计以及webgis项目等业务,欢迎有相关需求的客户来咨询
GIS之家接受webgis开发遇到的技术疑点难点在线咨询收费模式,有需要的加QQ:406503412,具体详情见:咨询模式
个人微信:gishome
欢迎关注GIS之家团队的微信公众号:扫描右上角头像
GIS作品:GIS之家
GIS之家知乎专栏:GIS之家知乎专栏
GIS之家交流群一:432512093(已满)
GIS之家交流群二:296438295(已满)
GIS之家交流群三:632467934
GIS之家接受webgis开发遇到的技术疑点难点在线咨询收费模式,有需要的加QQ:406503412,具体详情见:咨询模式
个人微信:gishome
欢迎关注GIS之家团队的微信公众号:扫描右上角头像
GIS作品:GIS之家
GIS之家知乎专栏:GIS之家知乎专栏
GIS之家交流群一:432512093(已满)
GIS之家交流群二:296438295(已满)
GIS之家交流群三:632467934
阅读全文
0 0
- arcgis api for js之echarts开源js库实现地图统计图分析
- arcgis api for js入门开发系列十一地图统计图
- ArcGIS API for JS 之创建地图
- ArcGIS API for JS 添加地图控件
- arcgis api for js 加载google地图
- Arcgis API for JS 地图小部件
- arcgis api for js 加载百度地图
- Arcgis for JS之地图自适应调整
- arcgis api for js入门开发系列十三地图最短路径分析
- ArcGIS API for Js 之 QueryTask详解
- 使用ArcGIS API for Silverlight + Visifire绘制地图统计图
- 使用ArcGIS API for Silverlight + Visifire绘制地图统计图
- 使用ArcGIS API for Silverlight + Visifire绘制地图统计图
- arcgis api for js共享干货系列之一自写算法实现地图量算工具
- Arcgis api for js:PrintTemplate可以做地图截图功能
- ArcGIS API for JS 之 不依赖地图服务创建FeatureLayer图层
- ArcGIS API for JS 之 不依赖地图服务创建FeatureLayer图层
- Arcgis for Javascript之统计图的实现
- (洛谷 1004 ssl 1010)方格取数
- 反向安装jar包到本地仓库
- 你好
- ElasticSearch 常用的结构化查询字符串(持续更新中...)
- AtCoder Beginner Contest 082
- arcgis api for js之echarts开源js库实现地图统计图分析
- Linux环境 无法通过terminal直接打开Vivado
- php算法和数据结构
- 使用Ajax实现登录验证
- 数据结构实验之查找三:树的种类统计
- 数据结构实验之排序四:寻找大富翁
- 服务机器人都有哪些产品?
- 网络七层协议
- Spring Boot 学习系列之拦截器,实现用户登录拦截