Memory Leak Detection in .NET
来源:互联网 发布:免费发布信息的软件 编辑:程序博客网 时间:2024/05/16 01:08
I found this good article from www.codeproject.com,and it is userful for. Memory Manager understanding .so I paste it from
http://www.codeproject.com/KB/dotnet/Memory_Leak_Detection.aspx
,want more ,please click the link.
Introduction
Usually, it is very cumbersome to detect and locate memory leaks.This article will provide a way to locate memory leaks in .NETapplications. First, I will talk about Resource Allocation and GarbageCollection algorithms, and then will talk about detecting leaks in .NETapps. Pay attention to the bold texts in the code section.
Background
Resource Allocation
The CLR (Common Language Runtime) allocates all the resources on themanaged heap and releases them when they are no longer required by theapplication. C/C++ applications were prone to memory leaks becauseprogrammers had to manually allocate and free memory.
The Runtime maintains a NextObjPtr for the next freespace on the heap. When a new process is initialized, the CLR allocatesa contiguous space on the heap for this process represented by NextObjPtr, and increments the NextObjPtrpointer to the next free space. The space is contiguous, and isdifferent from the C++ heap where it is maintained as a linked list. GCheap is efficient when compared to the C++ heap because to allocate newmemory, the GC doesn't have to search from a list of free memory orthrough a linked list. As times pass by, gaps start to appear in theheap as objects get deleted, and so GC has to compact the heap, whichis costly. GC in .NET uses the Win32 API VirtualAlloc or VirtualAllocEX to reserve memory.
.NET uses several types of memory like stack, unmanaged heap, and managed heap.
- Stack: It is managed on a per thread basis, and isused to store local variables, method parameters, and temporary values.GC doesn't clean the stack as its get automatically cleaned when themethod returns. The references to objects are stored on the stack, butthe actual object gets allocated on the heap and the GC is aware ofthat. When the GC cannot find a reference for an object, it removes itfrom the heap.
- Unmanaged Heap: Unmanaged code will allocateobjects on the unmanaged heap or stack. Managed code can also allocateobject on the unmanaged heap by calling Win32 APIs.
- Managed Heap: Managed code allocates objects onthe managed heap, and the GC takes care of the management of themanaged heap. The GC also maintains a Large Object Heap to compensatethe cost of moving large objects in memory.
Garbage Collection Algorithm
The garbage collector checks the heap for objects which are nolonger used by the application. If such objects exist, then the GCremoves those objects from the heap. Now, the question is how GC findsout about these objects which are not used by the application. Everyapplication maintains a set of roots. Roots are like pointers to theobjects on the heap. All global and static object pointers areconsidered as application roots. Any local variable on the thread stackis considered as application root. This list of roots is maintained bythe JIT compiler and the CLR, and is made available to the GC.
When the GC starts running, it treats all objects as garbage, andmakes an assumption that none of the objects on the heap areaccessible. It then starts walking with the list of application roots,and starts building a graph of accessible objects. It marks all theobjects on the heap as accessible if the objects are directlyaccessible lie an application root or indirectly accessible via anyother object. For each application, the GC maintains a tree ofreferences that tracks the objects referenced by the application. Usingthis approach, GC builds a list of live objects, and then walks throughthe heap in search of objects which are not present in this list oflive objects. After finding out the objects which are not present inthis list of live objects, it marks them all as garbage, and starts tocompact the memory to remove holes which were created by unreferenced(dead) objects. It uses the memcpy function to move the objects from one memory location to another, and modifies the application roots to point to new locations.
If there is a live reference to the object, then it is said to bestrongly rooted. .NET also has the concept of Weak Reference. Anyobject can be created as a weak reference which tells the GC that wewant to access this object, but if the GC is going through garbagecollection, then it can collect it. Weak reference is generally usedfor very large objects which are easy to create but are costly tomaintain in memory.
Moving objects in memory gives a significant performance hit. Toimprove performance, the GC does several optimizations like largeobject heap and generations. Objects which are in size greater than85,000 bytes are allocated on the large object heap. Moving largeobjects in memory is costly, so the GC maintains a separate heap forlarge objects, which it never compacts. The GC also maintainsgenerations of objects. Whenever a new object is to be allocated andthe managed heap doesn't have enough memory for the new object, a GCcollection is performed. For the first time, every object in the heapis considered in Gen 0. After that, the GC performs a collection. Theobjects which survive are moved to Gen 1, and similarly, those whichsurvive the Gen 1 collection move to Gen 2. The GC makes the assumptionthat a new object will have a short lifetime and an old object willhave a longer lifetime. Whenever new memory is required, the GC triesto collect memory from Gen 0, and if enough memory can't be obtainedfrom Gen 0 collections, then a Gen 1 or even Gen 2 collection isperformed.
GC Sequence
The following steps occur during each GC collection:
- Execution Engine Suspension – The EE is suspended until all managedthreads have reached a point in their code execution deemed "safe".
- Mark – Objects that don't have roots are marked garbage.
- Plan – The GC creates a budget for each generation being collected,and then determines the amount of fragmentation that will exist in themanaged heap as a result of a GC collection.
- Sweep – Deletes all objects marked for deletion.
- Compact – Moves all non-pinned objects that survived the GC to the lower end of the heap.
- Execution Engine Restart – Restart the execution of managed threads.
Roots in GC
There are different kinds of roots in the GC:
- Strong Reference – If a strong reference exists for an object, thenit is considered in use and is not collected during the next GCcollection.
- Weak Reference – This is also a reference, but the object can livetill the next GC collection. Weak Reference works like a cache for anobject.
Finalization
The GC can track an unmanaged resource's lifetime, but it can'treclaim the memory used by the resource unless destructors are used orcode is written to override the Finalize in the base class.
A finalizer exists to allow the programmer to clean up the nativeresources used by the object before the object is garbage collected.But, using a finalizer promotes the object collection to the nextgeneration. Whenever a new object with a Finalize methodis allocated on the heap, a pointer to that object is placed on theFinalization queue. During garbage collection, if the GC finds that anobject is not reachable, it then searches the Finalization queue forany reference to the object. If it finds a reference, then it removesthe object from the Finalization queue and appends it to other datastructure called a Freachable queue. At this point, the GarbageCollector has finished identifying garbage and compacts the memory.After that, the finalization thread empties the Freachable queue byexecuting each object's Finalize method. The next time aGC collection is performed, the GC sees this object as garbage andreclaims the memory assigned to this object.
It takes more time to reclaim the memory from objects having Finalize methods and affects performance, so a Finalize method should only be used when required.
Detecting Memory Leaks
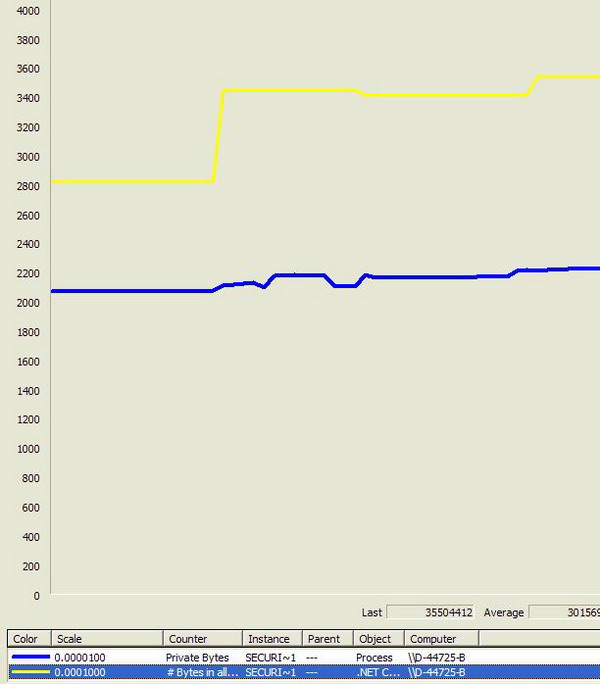
Memory leaks can occur either in the stack, unmanaged heap, or themanaged heap. There are many ways to find out that memory is leaking,like memory increasing in the Task Manager. Before starting to correctthe memory problem, you need to determine the kind of memory which isleaking. Perfmon can be used to examine counters such asProcess/Private bytes, .NET CLR Memory/# bytes in all heaps, and the.NET CLR LocksAndThreads/# of the current logical thread. If the .NETCLR LocksAndThreads/# is increasing unexpectedly, then the thread stackis leaking. If only Process/Private bytes are increasing but the .NETCLR Memory is not increasing, then unmanaged memory is leaking, else ifboth are increasing, then managed memory is leaking.
Stack Memory
Stack memory gets reclaimed after the method returns. Stack memorycan get leaked in two ways. First, a method call consumes a significantamount of stack resources that never returns, thereby never releasingthe associated stack frame. The other is by creating background threadsand never terminating them, thus leaking the thread stack.
Unmanaged Heap Memory
If the total memory usage is increasing but the .NET CLR memory isnot increasing, then unmanaged memory is leaking. Unmanaged memory canleak in several ways - if the managed code is interoperating withunmanaged code and a leak exists in the unmanaged code. .NET doesn'tmake any guarantee that the finalizer for each object will get called.In the current implementation, .NET has one finalizer thread. If thereexists a finalizer which blocks this thread, then the other finalizerwill never get called and the unmanaged memory will leak which wassupposed to be released. When an AppDomain is torn down, the CLR triesto run all the finalizers, but if a blocking finalizer exists, then itcan prevent the CLR from completing the AppDomain tear down. To preventthis, the CLR implements a timeout on the process, after which it stopsthe finalization process, and the unmanaged memory which was supposedto be removed is left leaked.
Managed Heap Memory
Managed memory can also get leaked by several ways likefragmentation of the Large Object Heap. The memory in the Large ObjectHeap never gets compacted, so there is a loss in memory over there.Also, if there exist some objects which are not needed, but thereexists a reference to the objects, then GC never claims the memoryassigned to these objects.
This kind of leak is common, and can be resolved using SOS.dll. There are two ways to use SOS.dll:
- WinDbg tool: This tool can be downloaded from Microsoft.
Run the application which you want to debug for memory problems. Start the WinDbg tool and attach it to the application process.
OR
- Open the application in Visual Studio 2005. Go to the properties ofthe project. In the Debug tab, make sure you have "Enable unmanagedcode debugging" checked, or if you are attaching to a process, then inthe "Attach to Process" window, click Select, and then select "Managedcode" and "Native code". Run the application, and set a breakpoint inthe code somewhere you want your application to break. Hit thebreakpoint. Go to Debug -> Windows -> Immediate.
- Run .load SOS.dll
The SOS.dll is the most popular debugging extension used todebug managed code. It has many powerful commands that can obtaininformation such as managed call stack, details about managed heap,objects in heap, and much more.
- Run !dumpheap –stat or !dumpheap –type PolicyEditor
This command scans the GC heaps and lists the objects that lie therein. The –Statargument is used to display the output to a statistical summary. Moreinformation about this (any) command can be found by using !help dumpheap.
The output will be like:
03f354ec       20         1120 View.Console.Configuration.Workspace
03713e44       35         1120 System.Windows.Forms.LayoutEventHandler
03710bec       56         1120 System.ComponentModel.Container+Site
024dc014       70         1120 System.Configuration.PropertySourceInfo
0492ed48       94         1128 Infragistics.Shared.SubObjectBase+NotifyId
081d9ac4        2         1136 View.Manger.UI.PolicyEditor
03d79898        1         1140 System.Text.RegularExpressions.RegexCharClass+
                               LowerCaseMapping[]
08857bdc       22         1144 Infragistics.Win.UltraWinToolbars.ComboBoxTool+
                               ComboBoxToolExtraSharedProps
0869c604 8 1152 Infragistics.Win.UltraWinEditors.UltraTextEditorUIElement- The above command will list all the objects present in the memory.If you think that an object should not be present in memory and shouldhave been garbage collected, then open a Find (Ctrl +F) window and typethe name of the object and search for it. If you cannot find theobject, then either it has been garbage collected, or it was notinstantiated. If you find the object, for example, the
PolicyEditorobject in the above list, then copy the MT (Method Table) address, which is 081d9ac4 in the above case. - Run !dumpheap -mt 081d9ac4
This will list all the objects with this MethodTable address. Those objects are the instances of
PolicyEditor.The output will be something like:
 ------------------------------
Heap 0
 Address       MT     Size
total 0 objects
------------------------------
Heap 1
 Address       MT     Size
total 0 objects
------------------------------
Heap 2
 Address       MT     Size
28404fd8 081d9ac4      568
total 1 objects
------------------------------
Heap 3
 Address       MT     Size
2c49f098 081d9ac4      568
total 1 objects
------------------------------
total 2 objects
Statistics:
      MT    Count    TotalSize Class Name
081d9ac4        2         1136 View.Manger.UI.PolicyEditor
Total 2 objects- Run !gcroot 28404fd8
This will list the path to this object from the root of theGC tree. If some path exists for this object, then this is considerednon garbage and is not collected by the GC, which could be a reason formemory leakage.
The output will be like:
Copy the address of any instance, for example, 28404fd8.
Error during command: warning!
Extension is using a feature which Visual does not implement.
Scan Thread 6460 OSTHread 193c
Scan Thread 1884 OSTHread 75c
Scan Thread 7520 OSTHread 1d60
Scan Thread 7716 OSTHread 1e24
Scan Thread 0 OSTHread 0
Scan Thread 7428 OSTHread 1d04
Scan Thread 0 OSTHread 0
Scan Thread 4728 OSTHread 1278

DOMAIN(01D637C8):HANDLE(Pinned):22b148c:Root:302d9250(System.Object[])->
2908633c(System.EventHandler)->
29085f2c(System.Object[])->
2c53a4cc(System.EventHandler)->
2c53a340(Infragistics.Win.UltraWinStatusBar.UltraStatusBar)->
2c5513b0(System.Collections.Hashtable)->
2c5513e8(System.Collections.Hashtable+bucket[])->
2c5390ac(Infragistics.Win.Printing.UltraPrintPreviewControl)->
2c530668(Infragistics.Win.UltraWinGrid.UltraGridPrintDocument)->
2c530858(System.Drawing.Printing.PrintEventHandler)->
2c52eff0(View.Windows.InfragisticsControls.CommonUltraGrid)->
24487ed0(System.EventHandler)->
2c52df64(View.Manger.UI.PolicyClarificationBrowser)->
2448f478(System.EventHandler)->
2c4e3714(View.Manger.UI.PolicyEditor)

DOMAIN(01D637C8):HANDLE(Pinned):22c12f8:Root:302d52b8(System.Object[])->
282e427c(System.Collections.Generic.Dictionary`2[[System.Object, mscorlib],
     [System.Collections.Generic.List`1
     [[Microsoft.Win32.SystemEvents+SystemEventInvokeInfo, System]],
     mscorlib]])->
282e4444(System.Collections.Generic.Dictionary`2+Entry[[System.Object, mscorlib],
     [System.Collections.Generic.List`1
     [[Microsoft.Win32.SystemEvents+SystemEventInvokeInfo, System]],
     mscorlib]][])->
282ee76c(System.Collections.Generic.List`1
     [[Microsoft.Win32.SystemEvents+SystemEventInvokeInfo, System]])->
2048e9c4(System.Object[])->
2c500534(Microsoft.Win32.SystemEvents+SystemEventInvokeInfo)->
2c500514(Microsoft.Win32.UserPreferenceChangedEventHandler)->
2c4fff54(Infragistics.Win.UltraWinStatusBar.UltraStatusBar)->
2446c824(System.Collections.Hashtable)->
2446c85c(System.Collections.Hashtable+bucket[])->
2c4fecc0(Infragistics.Win.Printing.UltraPrintPreviewControl)->
2c4f6a24(Infragistics.Win.UltraWinGrid.UltraGridPrintDocument)->
2c4f6c14(System.Drawing.Printing.PrintEventHandler)->
2c4f53ac(View.Windows.InfragisticsControls.CommonUltraGrid)->
2446e90c(System.EventHandler)->
24450e80(View.Manger.UI.EvidenceDefinitionMiniBrowser)->
2c4e34bc(View.Manger.Views.PolicyEditController)->
2c4e3524(View.Manger.Views.PolicyEdit)->
2449cfe0(System.Windows.Forms.LayoutEventArgs)->
2c4e3714(View.Manger.UI.PolicyEditor)

DOMAIN(01D637C8):HANDLE(WeakLn):22c1d88:Root:24496d2c(
                 System.Windows.Forms.NativeMethods+WndProc)->
2c4e39fc(System.Windows.Forms.Control+ControlNativeWindow)->
2c4e3714(View.Manger.UI.PolicyEditor)
DOMAIN(01D637C8):HANDLE(WeakSh):22e313c:Root:2c4e39fc(
System.Windows.Forms.Control+ControlNativeWindow)- In the above output, we can see that the
PolicyClarificationBrowserobject has an event handler which holds a reference toPolicyEditor. To find out who is hooking up this event, take the address of the event handler, which is 2448f478, and dump this object. - !dumpobj 2448f478
Name: System.EventHandler
MethodTable: 7910d61c
EEClass: 790c3a7c
Size: 32(0x20) bytes
 (C:/WINDOWS/assembly/GAC_32/mscorlib/2.0.0.0__b77a5c561934e089/mscorlib.dll)
Fields:
      MT    Field   Offset                 Type VT     Attr    Value Name
790f9c18  40000f9        4        System.Object  0 instance 2c4e3714 _target
79109208  40000fa        8 ...ection.MethodBase  0 instance 00000000 _methodBase
790fe160  40000fb        c        System.IntPtr  0 instance 140144060 _methodPtr
790fe160  40000fc       10        System.IntPtr  0 instance        0 _methodPtrAux
790f9c18  4000106       14        System.Object  0 instance 00000000 _invocationList
790fe160 4000107 18 System.IntPtr 0 instance 0 _invocationCount- If you take the address of the target in the above output, which is 2c4e3714, and run a !dumpobj with this address, then you can see in the output that it is of type
PolicyEditor. To get the method that is hooked up as a handler, convert the int value in_methodPtrto hex.?0n140144060
(This command will not work in the Immediate Window. To run thiscommand, you need to attach WinDbg to this or any other managedprocess, or use Google to do that.)
The output will be:
Evaluate expression: 140144060 = 085a6dbc
And then run !ip2md 085a6dbc
Failed to request MethodData, not in JIT code range- !dumpobj 2c4e3714
The output will be:
Sometimes this works, and will give you the name of the method, butif doesn't work, then we can dump the object and then find out themethod.
Name: View.Manger.UI.PolicyEditor
MethodTable: 0820865c
EEClass: 08219fd8
Size: 568(0x238) bytes
 (C:/Documents and Settings/testuser/Application Data/View/SMC-D-44725-B/View.Manger.UI.dll)
Fields:
      MT    Field   Offset                 Type VT     Attr    Value Name
790f9c18  4000184        4        System.Object  0 instance 00000000 __identity
024c1798  40008bc        8 ...ponentModel.ISite  0 instance 00000000 site
036f9c3c  40008bd        c ....EventHandlerList  0 instance 2448f8ac events
790f9c18 40008bb 108 System.Object 0 static 242e1afc EventDisposed- !dumpmt -md 0820865c
The output will be:
EEClass: 08219fd8
Module: 036e48d8
Name: View.Manger.UI.PolicyEditor
mdToken: 02000069  (C:/Documents and Settings/testuser/Application Data/
                    View/SMC-D-44725-B/View.Manger.UI.dll)
BaseSize: 0x238
ComponentSize: 0x0
Number of IFaces in IFaceMap: 15
Slots in VTable: 430
--------------------------------------
MethodDesc Table
   Entry MethodDesc      JIT Name
022a9fc5   022a9ec8     NONE System.ComponentModel.Component.ToString()
793539c0   7913bd50   PreJIT System.Object.Equals(System.Object)
…
…
085a6d44   08208578     NONE View.Manger.UI.PolicyEditor.btnStatementDelete_Click(
                             System.Object, System.EventArgs)
085a6de4   08208580     NONE View.Manger.UI.PolicyEditor.btnProperties_Click(
                             System.Object, System.EventArgs)
085a6dbc   08208588     NONE View.Manger.UI.PolicyEditor.ClarificationBrowser_OpenClick(
                             System.Object, System.EventArgs)
08208f0d   08208590     NONE View.Manger.UI.PolicyEditor.OpenClarification()
085a6dd0   08208598     NONE View.Manger.UI.PolicyEditor.Clarification_SelectionChanged(
                             System.Object, View.Manger.UI.SelectEventArgs)
085a6d94   082085a0     NONE View.Manger.UI.PolicyEditor.btnExceptionNew_Click(
                             System.Object, System.EventArgs)

…
…
In the above output, search for the hex address we calculated above from _methodptr, and you will get the name of the method which is still holding a reference to the PolicyEditor object and is the reason for the memory leak.
- Memory Leak Detection in .NET
- Memory Leak Detection in C++
- Memory Leak Detection in C++
- Memory leak detection in C++
- Memory Leak Detection in Embedded Systems
- Memory Leak Detection in Visual Studio
- Memory Leak Detection Enabling in VS.
- Enabling Memory Leak Detection
- Android memory leak detection
- Memory Leak Detection Using Windbg
- memory leak in occi
- Memory leak in WebView
- (Memory and Resource) Leak detection for WinCE
- Visual Studio 2015 memory leak detection
- Automatic memory leak detection on iOS
- Visual Leak Detector - Enhanced Memory Leak Detection for Visual C++
- Visual Leak Detector - Enhanced Memory Leak Detection for Visual C++
- Visual Leak Detector - Enhanced Memory Leak Detection for Visual C++
- 公民意志与道德
- i 标签
- 常见排序算法
- 两个浮点数比较大小方法
- SEO之关键字排名如何提高
- Memory Leak Detection in .NET
- 六十星系之48天同独坐巳亥
- 关于PowerDesigner 15/12.5 生成自增字段的问题
- ADSL自动拨号上网:上海贝曼元脉HomeAccess Ha510路由配置
- 小宝宝
- 首篇
- 高手帮我啊!
- 基于P2P的Internet隐私保护与匿名通信技术
- 在SSIS中使用Web Service任务进行集成