在asp.net mvc上应用新ASP.NET图表控件
来源:互联网 发布:thinkphp三级分销源码 编辑:程序博客网 时间:2024/06/01 09:05
微软去年11月发布了一个很酷的新ASP.NET服务器控件,<asp:chart />,可以免费用在ASP.NET 3.5中,而且还可以用在asp.net mvc。可以看新ASP.NET图表控件<asp:chart runat="server"/>。
相关资源的下载链接:
这位台胞的两篇相当不错的文章
Microsoft Chart Controls 心得(1)
Microsoft Chart Controls 心得(2) - 如何透過圖表傳值
园子里的相关文章:
ASP.NET图表控件
我今天才知道ASP.NET图表控件发布了,附一个在线文档
.NET MSChart应用的一个简单例子
告别.NET生成报表统计图的烦恼
在这里有一篇文章简短介绍了Combining ASP.NET MVC and ASP.NET Charting Controls.
编辑Web.Config
将控件的命名空间加到 (path: "<system.web><pages><controls>") :
<add tagPrefix="asp" namespace="System.Web.UI.DataVisualization.Charting" assembly="System.Web.DataVisualization, Version=3.5.0.0, Culture=neutral, PublicKeyToken=31bf3856ad364e35"/>
添加一个 httpHandler ("<httpHandlers>"下面) :<add path="ChartImg.axd" verb="GET,HEAD" type="System.Web.UI.DataVisualization.Charting.ChartHttpHandler, System.Web.DataVisualization, Version=3.5.0.0, Culture=neutral, PublicKeyToken=31bf3856ad364e35" validate="false"/>
将chart 控件添加到view
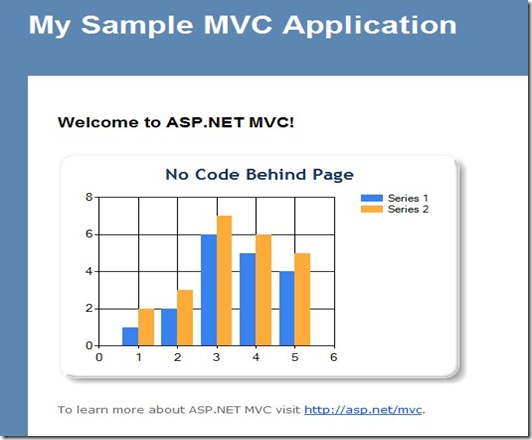
<p><%System.Web.UI.DataVisualization.Charting.Chart Chart2 = new System.Web.UI.DataVisualization.Charting.Chart();Chart2.Width = 412;Chart2.Height = 296;Chart2.RenderType = RenderType.ImageTag;Chart2.Palette = ChartColorPalette.BrightPastel;Title t = new Title("No Code Behind Page", Docking.Top, new System.Drawing.Font("Trebuchet MS", 14, System.Drawing.FontStyle.Bold), System.Drawing.Color.FromArgb(26, 59, 105));Chart2.Titles.Add(t);Chart2.ChartAreas.Add("Series 1");// create a couple of seriesChart2.Series.Add("Series 1");Chart2.Series.Add("Series 2");// add points to series 1foreach (int value in (List<int>)ViewData["Chart"]){Chart2.Series["Series 1"].Points.AddY(value);}// add points to series 2foreach (int value in (List<int>)ViewData["Chart"]){Chart2.Series["Series 2"].Points.AddY(value + 1);}Chart2.BorderSkin.SkinStyle = BorderSkinStyle.Emboss;Chart2.BorderColor = System.Drawing.Color.FromArgb(26, 59, 105);Chart2.BorderlineDashStyle = ChartDashStyle.Solid;Chart2.BorderWidth = 2;Chart2.Legends.Add("Legend1");// Render chart controlChart2.Page = this;HtmlTextWriter writer = new HtmlTextWriter(Page.Response.Output);Chart2.RenderControl(writer);%></p>
效果如下:
本文代码基于asp.net mvc rc版本:MVCCharting
Streaming Chart Images as FileResult from MVC Controllers : http://www.codeproject.com/KB/aspnet/MvcChartControlFileResult.aspx用 ASP.NET 和 LINQ 图表的终极 ASP.NET :http://msdn.microsoft.com/zh-cn/magazine/dd453008.aspx.csharpcode, .csharpcode pre{font-size: small;color: black;font-family: consolas, "Courier New", courier, monospace;background-color: #ffffff;/*white-space: pre;*/}.csharpcode pre { margin: 0em; }.csharpcode .rem { color: #008000; }.csharpcode .kwrd { color: #0000ff; }.csharpcode .str { color: #006080; }.csharpcode .op { color: #0000c0; }.csharpcode .preproc { color: #cc6633; }.csharpcode .asp { background-color: #ffff00; }.csharpcode .html { color: #800000; }.csharpcode .attr { color: #ff0000; }.csharpcode .alt{background-color: #f4f4f4;width: 100%;margin: 0em;}.csharpcode .lnum { color: #606060; }.csharpcode, .csharpcode pre{font-size: small;color: black;font-family: consolas, "Courier New", courier, monospace;background-color: #ffffff;/*white-space: pre;*/}.csharpcode pre { margin: 0em; }.csharpcode .rem { color: #008000; }.csharpcode .kwrd { color: #0000ff; }.csharpcode .str { color: #006080; }.csharpcode .op { color: #0000c0; }.csharpcode .preproc { color: #cc6633; }.csharpcode .asp { background-color: #ffff00; }.csharpcode .html { color: #800000; }.csharpcode .attr { color: #ff0000; }.csharpcode .alt{background-color: #f4f4f4;width: 100%;margin: 0em;}.csharpcode .lnum { color: #606060; }- 在asp.net mvc上应用新ASP.NET图表控件
- 新ASP.NET图表控件
- 新ASP.NET图表控件
- ASP.NET Core MVC TagHelper实践HighchartsNET快速图表控件
- MVC模式在ASP.NET中的应用
- MVC模式在ASP.NET中的应用
- MVC模式在ASP.NET中的应用
- SignalR在ASP.NET MVC中的应用
- 在ASP.NET中应用TreeView控件
- ASP.NET MVC 第一部分 创建一个新的ASP.NET MVC应用
- javascript在 Asp.Net上的应用
- ASP.NET MVC 分页控件
- Asp.net MVC 分页控件
- Asp.net MVC 常用控件
- ASP.NET MVC控件解析
- ASP.NET MVC 入门(上)
- ASP.NET下的图表控件
- asp.net图表控件chartlet网址
- Silverlight 和WPF的Composite Guidance(Prism V2)发布了
- 细细品味PHP程序的算法
- Ironclad
- IIS7 request routing 和load balancing module发布
- Developer.com发布2009年度技术产品获奖名单
- 在asp.net mvc上应用新ASP.NET图表控件
- RIA 应用程序模式
- WCF安全指南
- Silverlight 2 开发环境
- 推荐一个工具包自定义HTTP 404错误
- ASP.NET MVC Release Candidate 1学习指南
- DNF为什么会火~
- 【转】软件性能测试前期需求分析
- 移除由MXML标签添加的侦听