Trace System Calls
来源:互联网 发布:淘宝无线宝推广 编辑:程序博客网 时间:2024/05/24 06:30
Sometimes, it's helpful to trace system api calls during debugging so that we can determine if the incorrect behavior is caused by passing wrong argument to a function or not. Or we can try to identify the performance bottleneck with it. There are several tools to use with this purpose.
For demonstration purpose, we'll use code below to try these tools
The result of logger is saved in a binary file placed in LogExts folder, and the file need to be opened in LogViewer. The file only records all APIs being called based on their orders, so we can't identify calling relationships between them. The figure belows shows the result of tracing ProcessAndThreads and ioFunctions module: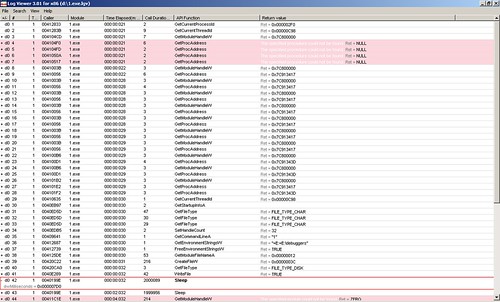 From the row #42 which is expanded, we can see the parameter passed to Sleep function is 0x000007d0 which is 2000 in decimal.
2. wt command in windbg windbg has another powerful command wt. Compared with logger extension, it has more controls over which apis shall be traced. Actually, it can also trace user's function call. And the wonderful thing with it is it can show the calling relationship with a tree. It should be a preferable way. To use it, we set a break point in the place of interest. Then issue wt command. The debugee shall continue executing until this function returns. We perform wt on the sample code, the output is:
For demonstration purpose, we'll use code below to try these tools
1 #include "Windows.h" / "unistd.h"
2 #include "fstream"
3 using namespace std;
4
5 void foo()
6 {
7 Sleep(2000); // windows
8 sleep(2); // linux
9 }
10
11 void bar()
12 {
13 ofstream of("foo.dat");
14 char buf[] = {1, 2, 3, 4, 5, 6, 7, 8, 9, 10, 11, 12, 13, 14, 15, 16};
15 of << buf;
16 of.close();
17
18 foo();
19 }
20
21 int main()
22 {
23 bar();
24 foo();
25 return 0;
26 }
1. Logger This tool can be used as a standalone application or used as a debugger extension in windbg. It's capable of keeps records of all system api calls and corresponding parameters, return value, time spent, calling module and thread. To run as a application, simply call "logger.exe application to be traced". Then you can specify some option and filter in the window popped up. But standalone logger application isn't suitable for tracing windows service. In this case, we can attach windbg to a target process and load logexts extension to work against a service.2 #include "fstream"
3 using namespace std;
4
5 void foo()
6 {
7 Sleep(2000); // windows
8 sleep(2); // linux
9 }
10
11 void bar()
12 {
13 ofstream of("foo.dat");
14 char buf[] = {1, 2, 3, 4, 5, 6, 7, 8, 9, 10, 11, 12, 13, 14, 15, 16};
15 of << buf;
16 of.close();
17
18 foo();
19 }
20
21 int main()
22 {
23 bar();
24 foo();
25 return 0;
26 }
The result of logger is saved in a binary file placed in LogExts folder, and the file need to be opened in LogViewer. The file only records all APIs being called based on their orders, so we can't identify calling relationships between them. The figure belows shows the result of tracing ProcessAndThreads and ioFunctions module:
From the row #42 which is expanded, we can see the parameter passed to Sleep function is 0x000007d0 which is 2000 in decimal.2. wt command in windbg windbg has another powerful command wt. Compared with logger extension, it has more controls over which apis shall be traced. Actually, it can also trace user's function call. And the wonderful thing with it is it can show the calling relationship with a tree. It should be a preferable way. To use it, we set a break point in the place of interest. Then issue wt command. The debugee shall continue executing until this function returns. We perform wt on the sample code, the output is:
0:000> wt -l 4Tracing 1!main to return address 004096a13 0 [ 0] 1!main1 0 [ 1] 1!ILT+540(?barYAXXZ)12 0 [ 1] 1!bar...37 1069 [ 1] 1!bar1 0 [ 2] 1!ILT+735(?fooYAXXZ)4 0 [ 2] 1!foo6 0 [ 3] kernel32!Sleep37 0 [ 4] kernel32!SleepEx8 37 [ 3] kernel32!Sleep6 45 [ 2] 1!foo39 1121 [ 1] 1!bar...42 1209 [ 1] 1!bar3 0 [ 2] 1!__security_check_cookie45 1212 [ 1] 1!bar4 1258 [ 0] 1!main1 0 [ 1] 1!ILT+735(?fooYAXXZ)4 0 [ 1] 1!foo6 0 [ 2] kernel32!Sleep3 0 [ 3] kernel32!SleepEx19 0 [ 4] kernel32!_SEH_prolog15 19 [ 3] kernel32!SleepEx20 0 [ 4] ntdll!RtlActivateActivationContextUnsafeFast20 39 [ 3] kernel32!SleepEx19 0 [ 4] kernel32!BaseFormatTimeOut26 58 [ 3] kernel32!SleepEx1 0 [ 4] ntdll!ZwDelayExecution3 0 [ 4] ntdll!NtDelayExecution31 62 [ 3] kernel32!SleepEx4 0 [ 4] kernel32!SleepEx36 66 [ 3] kernel32!SleepEx9 0 [ 4] kernel32!_SEH_epilog37 75 [ 3] kernel32!SleepEx8 112 [ 2] kernel32!Sleep6 120 [ 1] 1!foo7 1385 [ 0] 1!main1392 instructions were executed in 1391 events (0 from other threads)Function Name Invocations MinInst MaxInst AvgInst1!ILT+1010(??0?$basic_ofstreamDU?$char_traitsDs 1 1 1 11!ILT+1040(?sputn?$basic_streambufDU?$char_trai 1 1 1 11!ILT+1060(?close?$basic_ofstreamDU?$char_trait 1 1 1 11!ILT+1090(??0sentry?$basic_ostreamDU?$char_tra 1 1 1 11!ILT+1125(?flagsios_basestdQBEHXZ) 1 1 1 11!ILT+1155(?getloc?$basic_streambufDU?$char_tra 1 1 1 11!ILT+1185(??0_Sentry_base?$basic_ostreamDU?$ch 1 1 1 11!ILT+1210(?_Osfx?$basic_ostreamDU?$char_traits 1 1 1 11!ILT+130(??1localestdQAEXZ) 1 1 1 1...1!ILT+950(??0?$basic_streambufDU?$char_traitsDs 1 1 1 11!ILT+965(??1?$basic_ofstreamDU?$char_traitsDst 1 1 1 11!__security_check_cookie 1 3 3 31!__uncaught_exception 1 6 6 61!bar 1 45 45 451!fclose 1 27 27 271!foo 2 6 6 61!main 1 7 7 71!std::_Fiopen 1 29 29 29...1!strlen 1 52 52 52kernel32!BaseFormatTimeOut 1 19 19 19kernel32!Sleep 2 8 8 8kernel32!SleepEx 3 4 37 26kernel32!_SEH_epilog 1 9 9 9kernel32!_SEH_prolog 1 19 19 19ntdll!NtDelayExecution 1 3 3 3ntdll!RtlActivateActivationContextUnsafeFast 1 20 20 20ntdll!ZwDelayExecution 1 1 1 10 system calls were executedeax=00000000 ebx=7ffd6000 ecx=7c80240f edx=7c90e514 esi=00dcf766 edi=00dcf6f2eip=004096a1 esp=0012ff80 ebp=0012ffc0 iopl=0 nv up ei pl zr na pe nccs=001b ss=0023 ds=0023 es=0023 fs=003b gs=0000 efl=000002461!__tmainCRTStartup+0xfb:03. strace on linux strace is similar to logger on windows in that it only trace api calls in a flat structure.
- Trace System Calls
- 8.1. System Calls
- Linux System Calls
- Kernel System Calls
- Finding system calls
- Using System Calls
- [OS] Xv6 System Calls
- Trace and profile function calls with GCC
- Trace and profile function calls with GCC
- linux File-Handling System Calls
- Tool to trace local function calls in Linux
- Windos 7 SYSTEM CALLS (WINDOWS SSDT)
- Linux Kernel Interrupts, Exceptions and System Calls
- List of Linux/i386 system calls
- How system calls work in Linux
- Kernel command using Linux system calls
- The Definitive Guide to Linux System Calls
- Linux System Calls Hooking Method Summary LD_PRELOAD
- logging in android
- native programming on android
- View android source code in eclipse
- Beginning Android Development
- understanding dynamic cast
- Trace System Calls
- Design for debugging
- Use trace point in windbg
- View memory usage
- A great book for asp.net mvc
- Use VI command in bash
- Minimize Code Explosion of Generic Type
- GoAhead Web Server Hang
- Macro expansion and Assembly code