6款jQuery图表插件
来源:互联网 发布:每天工作记录软件 编辑:程序博客网 时间:2024/06/06 03:47
图表应用能让数据显示更加直观易懂,但光靠CSS+Xhtml或纯图片实现的图表显然有很多局限性,强大的jquery让我们可以实现各种很强大的图表,下面是6款jQuery图表插件,另外,你也许也愿意看看7款在线图表制作工具。
1,Flot

从交互性的层面来说,jQuery实现的 Flot图表和Flash实现的图表效果已经是非常的接近。图表输出效果相当的流畅光滑,注重视觉效果。你也可以和data points数据节点配合使用,当鼠标hover到某个数据节点时,会得到对应节点的数值说明内容的反馈信息。
如上图所示,你也可以选择图表的一部分内容,获得这些特殊区域的数据;同时,你还可以对数据节点进行放大处理。
优势: 线条、节点、区域填充、柱状图以及以上功能的组合。
2,Sparklines

Sparklines 是我最欣赏的微型图表实现工具。真正实现了仪表风格的图表样式(登录到你的 Google Analytics 就知道什么样子了)。另外一个好的功用就是,可以帮助在所有的图表插件中实现 self-refresh 的能力。
优势: 楔形、线条、柱状图以及以上功能的组合。
3, Google Charts Plugin

Google Charts plugin 是通过jQuery插件将Google Charts API应用到Web程序的一个非常简单的方式。同时,这个 API 本身也是非常的简单易用 。允许使用简单的jQuery调用,设置你自己需要的参数:
.attr(<span>'src'</span>, api.make(<span><strong>{</strong></span>data : [[<span>153</span>, <span>60</span>, <span>52</span>], [<span>113</span>, <span>70</span>, <span>60</span>], [<span>120</span>, <span>80</span>, <span>40</span>]]<strong>}</strong>))
优势: 柱状图、重叠柱状图、线条、楔形、3D楔形。
4,
jQuery Chart 0.21
0.21

jQuery Chart 0.21看起来似乎并不是一个特别好看的图表插件。实现的也是基本的功能,但它的使用却是非常灵活、易用的。
实例(添加值给图表)
.chartAdd({”label”:”Leads”,”type”:”Line”,”color”:”#008800″,”values”:["100","124","222","44","123","23","99"]})
优势: 区块、线条、柱状图以及以上功能的组合。
5,jQchart

jQchart 可以实现在图表中的拖拽动作和动画转换功能。如果你的CSS应用够好,可以实现外观不错的图表效果。与其他插件相比,jQchart的实现功能似乎有些单一。
优势: 柱状图、线条
6,TufteGraph

Tuftegraph 生成的柱状图漂亮精致,而且可以实现层叠效果。相比Flot 的精致小巧,Tuftegraph也可以实现自身的减压,变得更加轻便。
优势: 柱状图、重叠柱状图。
以上6中同样通过jQuery实现的图表效果,却各有各的优势和局限,你可以根据自身项目的需求,有选择性地使用,我们的原则就是:简单、实用、兼容性强。
re free for personal and commercial use.
1. jQuery Visualize Plugin
jQuery Visualize Plugin is the perfect plugin if you have a table and want to generate a chart out of it. It offers different types of charts such as Bar, Area, Pie & Line charts.
Examples
Type of Charts: Bar, Area, Pie & Line.
Requirements: jQuery, excanvas (included)
Browser Support: IE6*, IE7*, IE8*, Firefox 2, Firefox 3.5, Safari 3 and 4, Opera 9.
* HTML 5 canvas element is not supported by IE but Google maintains a library that translates canvas scripting into VML, allowing it to work in all versions of internet explorer.
Demo: http://www.filamentgroup.com/examples/charting_v2/index_2.php
License: MIT and GPL licenses
2. Highcharts
Highcharts is a really impressive jQuery Chart Library. In a few words Highcharts is compatible with most Browsers and even the iPhone; numerous chart types are supported; it is a dynamic plugin because you can add, remove and modify series, axes or points at any time after chart creation and you can load data from external files; tooltip labels are also supported which is great for detailed information in a point of a chart; zooming and last but not least all text labels can be rotated in any angle.
Examples
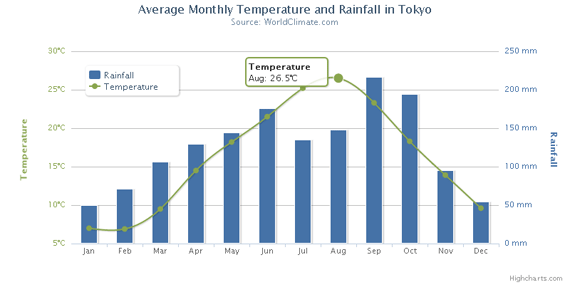
Line and column example
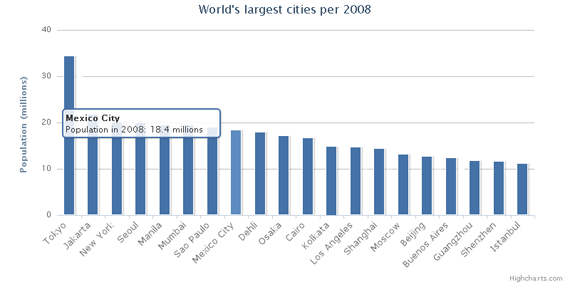
Columns with rotated labels
Type of Charts: Bar, Area, Areaspline , Pie, Line, Spline, Column & Scatter.
Requirements: jQuery or MooTools
Browser Support: IE6, IE7, IE8, Firefox 2, Firefox 3.5, Safari 3 and 4, Opera 9 and iPhone!
Demo: http://www.highcharts.com/demo/
License: Creative Commons Attribution Non-Commercial 3.0 License. Free for personal website, a school site or a non-profit organization. For a single commercial Website the license costs $80.
5. jqPlot
jqPlot did not catch my eye at first glance but after further research I found it to be one of the best and free jQuery chart library. Numerous graphical options are available you can even add shadows and interact per drag&drop in the charts! It even automatically computes trend lines. We could compare it to highcharts in terms of features and functionality.
Examples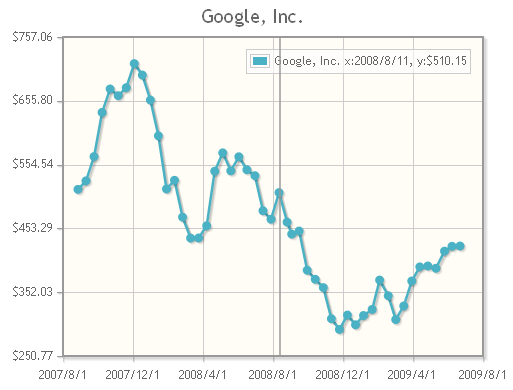
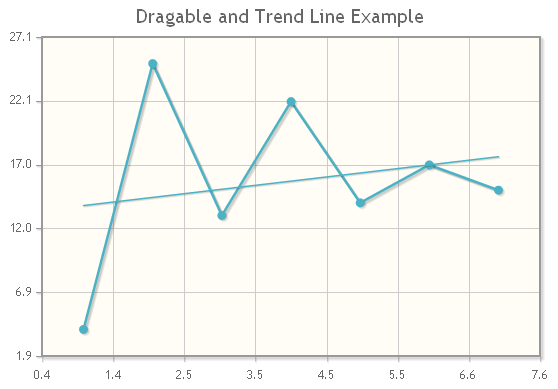
Type of Charts: Bar, Pie & Line.
Requirements: jQuery
Browser Support: IE6, IE7, IE8, Firefox 2, Firefox 3.5, Safari 3 and 4, Opera 9 and Google Chrome.
Demo: http://www.jqplot.com/tests/
License: MIT and GPL version 2 licenses
- 6款jQuery图表插件
- 6款jQuery图表插件
- jquery图表插件highcharts
- jQuery图表插件
- jquery图表插件
- jquery 图表插件highcharts
- jquery flot图表插件
- 漂亮的JQuery图表插件
- 不错的jQuery图表插件
- jquery 图表插件highcharts & highstock
- JQuery图表插件之Flot
- jQuery 图表插件 jqChart 使用
- jquery图表插件highcharts使用
- jquery.flot图表插件使用
- flot - jQuery 图表插件(jquery.flot)使用
- JQuery图表插件jquery.flot.js
- flot - jQuery 图表插件(jquery.flot)使用
- 强大的前端绘制图表(jQuery)插件
- 面试题(循环链表)
- 2010年8月19号
- hdu1231 最大子序列
- C++著名程序库
- ORA-12514:TNS:监听程序当前无法识别连接描述符中请求的服务
- 6款jQuery图表插件
- EVC 下控件
- zhuan zhai学习C++:实践者的方法
- 使用ffmpeg命令小结
- SQL学习笔记3(凌乱的代码)
- C# ASP.NET程序员整合Java门户单点登录PHPwind论坛博客软件集成项目经验总结
- 稳扎稳打Silverlight(45) - 4.0浏览器外运行(Out Of Browser)之被信任的应用程序(Trusted Application)
- 我想要一個DOS的編程教程誰給我一個
- MultiByteToWideChar和WideCharToMultiByte用法详解


