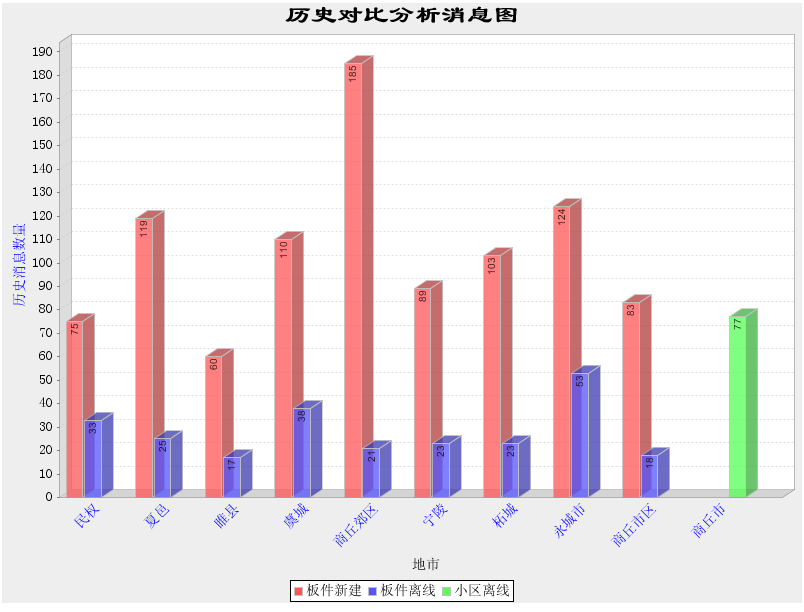
JFreeChart 柱状图参数设置方法
来源:互联网 发布:身份证读卡器破解软件 编辑:程序博客网 时间:2024/05/01 07:13

Java代码
- import java.awt.Color;
- import java.awt.Font;
- import java.text.DecimalFormat;
- import org.jfree.chart.JFreeChart;
- import org.jfree.chart.axis.CategoryAxis;
- import org.jfree.chart.axis.CategoryLabelPositions;
- import org.jfree.chart.axis.NumberAxis;
- import org.jfree.chart.axis.ValueAxis;
- import org.jfree.chart.labels.ItemLabelAnchor;
- import org.jfree.chart.labels.ItemLabelPosition;
- import org.jfree.chart.labels.StandardCategoryToolTipGenerator;
- import org.jfree.chart.labels.StandardCategoryItemLabelGenerator;
- import org.jfree.chart.plot.CategoryPlot;
- import org.jfree.chart.renderer.category.BarRenderer;
- import org.jfree.chart.renderer.category.BarRenderer3D;
- import org.jfree.chart.title.TextTitle;
- import org.jfree.ui.TextAnchor;
主代码:
- /**
- * 格式化 JFreeChart 输出图片使用
- *
- *
- * Author : 李斌
- * Date : Nov 26, 2009
- * Time : 11:50:41 AM
- * Version: 1.0
- */
- public class FormatPic {
- /**
- * 格式化纵向柱状图使用
- *
- * @param chart
- * @returnType: void
- * @author:
- * @data: Nov 26, 2009
- * @time: 11:51:26 AM
- */
- public static void setView(JFreeChart chart){
- // 初始化字体
- Font labelFont = new Font("SansSerif", Font.TRUETYPE_FONT, 14);
- Font noFont = new Font("SansSerif", Font.TRUETYPE_FONT, 48);
- // 格式化 图片
- CategoryPlot plot = chart.getCategoryPlot();
- // 没有数据是显示的消息
- plot.setNoDataMessage("没有数据!");
- //// 没有数据时显示的消息字体
- plot.setNoDataMessageFont(noFont);
- //// 没有数据时显示的消息颜色
- plot.setNoDataMessagePaint(Color.RED);
- // // 数据轴精度
- NumberAxis vn = (NumberAxis) plot.getRangeAxis();
- // // 数据轴数据标签的显示格式
- CategoryAxis domainAxis = plot.getDomainAxis();
- //
- // // 设置刻度必须从0开始
- vn.setAutoRangeIncludesZero(true);
- //// 设置纵坐标数据精度
- //// DecimalFormat df = new DecimalFormat("#0.00");
- //// vn.setNumberFormatOverride(df);
- //
- //
- // x轴设置
- domainAxis.setLabelFont(labelFont);// 轴标题
- domainAxis.setTickLabelFont(labelFont);// 轴数值
- // y轴设置
- ValueAxis rangeAxis = plot.getRangeAxis();
- rangeAxis.setLabelFont(labelFont);
- rangeAxis.setTickLabelFont(labelFont);
- // 三维设置
- BarRenderer3D renderer = new BarRenderer3D();
- // // 设置柱子宽度
- renderer.setMaximumBarWidth(0.05);
- // // 设置柱子高度
- // renderer.setMinimumBarLength(0.2);
- // // 设置柱子边框颜色
- renderer.setBaseOutlinePaint(Color.BLACK);
- // // 设置距离图片左端距离
- domainAxis.setLowerMargin(0.01);
- // // 设置距离图片右端距离
- // domainAxis.setUpperMargin(0.2);
- //
- // // 设置显示位置
- //// plot.setDomainAxisLocation(AxisLocation.TOP_OR_RIGHT);
- //// plot.setRangeAxisLocation(AxisLocation.BOTTOM_OR_RIGHT);
- //
- // plot.setDomainAxis(domainAxis);
- // // 设置柱图背景色(注意,系统取色的时候要使用16位的模式来查看颜色编码,这样比较准确)
- // plot.setBackgroundPaint(new Color(255, 255, 204));
- // //设置柱子上数值的字体
- // renderer.setItemLabelFont(new Font("宋体",Font.PLAIN,14));
- // renderer.setItemLabelsVisible(true);
- // //设置柱子上数据的颜色
- // renderer.setItemLabelPaint(Color.RED);
- // 指定分类的数据标签的字体
- renderer.setSeriesItemLabelFont(3,labelFont);
- // 指定分类的数据标签的字体颜色
- renderer.setSeriesItemLabelPaint(3,Color.RED);
- //
- //设置柱子上比例数值的显示,如果按照默认方式显示,数值为方向正常显示
- //设置柱子上显示的数据旋转90度,最后一个参数为旋转的角度值/3.14
- ItemLabelPosition itemLabelPosition= new ItemLabelPosition(
- ItemLabelAnchor.INSIDE12,TextAnchor.CENTER_RIGHT,
- TextAnchor.CENTER_RIGHT,-1.57D);
- //下面的设置是为了解决,当柱子的比例过小,而导致表示该柱子比例的数值无法显示的问题
- //设置不能在柱子上正常显示的那些数值的显示方式,将这些数值显示在柱子外面
- ItemLabelPosition itemLabelPositionFallback=new ItemLabelPosition(
- ItemLabelAnchor.OUTSIDE12,TextAnchor.BASELINE_LEFT,
- TextAnchor.HALF_ASCENT_LEFT,-1.57D);
- //设置正常显示的柱子label的position
- renderer.setPositiveItemLabelPosition(itemLabelPosition);
- renderer.setNegativeItemLabelPosition(itemLabelPosition);
- //设置不能正常显示的柱子label的position
- renderer.setPositiveItemLabelPositionFallback(itemLabelPositionFallback);
- renderer.setNegativeItemLabelPositionFallback(itemLabelPositionFallback);
- // 显示每个柱的数值,并修改该数值的字体属性
- renderer.setIncludeBaseInRange(true);
- renderer.setBaseItemLabelGenerator(new StandardCategoryItemLabelGenerator());
- renderer.setBaseItemLabelsVisible(true);
- //以下设置,将按照指定格式,制定内容显示每个柱的数值。可以显示柱名称,所占百分比
- // renderer.setBaseItemLabelGenerator(new StandardCategoryItemLabelGenerator("{2}",new DecimalFormat("0.0%")));
- // // 横轴上的label旋转90 度
- // domainAxis.setCategoryLabelPositions(CategoryLabelPositions.DOWN_90);
- // // 设置每个平行柱之间距离
- renderer.setItemMargin(0.05);
- //
- plot.setRenderer(renderer);
- }
Java代码
- /**
- * 配置字体
- * @param chart JFreeChart 对象
- */
- public static void configFont(JFreeChart chart){
- // 配置字体
- Font xfont = new Font("宋体",Font.PLAIN,14) ;// X轴
- Font yfont = new Font("宋体",Font.PLAIN,14) ;// Y轴
- Font kfont = new Font("宋体",Font.PLAIN,14) ;// 底部
- Font titleFont = new Font("隶书", Font.BOLD , 25) ; // 图片标题
- CategoryPlot plot = chart.getCategoryPlot();// 图形的绘制结构对象
- // 图片标题
- chart.setTitle(new TextTitle(chart.getTitle().getText(),titleFont));
- // 底部
- chart.getLegend().setItemFont(kfont);
- // X 轴
- CategoryAxis domainAxis = plot.getDomainAxis();
- domainAxis.setLabelFont(xfont);// 轴标题
- domainAxis.setTickLabelFont(xfont);// 轴数值
- domainAxis.setTickLabelPaint(Color.BLUE) ; // 字体颜色
- domainAxis.setCategoryLabelPositions(CategoryLabelPositions.UP_45); // 横轴上的label斜显示
- // Y 轴
- ValueAxis rangeAxis = plot.getRangeAxis();
- rangeAxis.setLabelFont(yfont);
- rangeAxis.setLabelPaint(Color.BLUE) ; // 字体颜色
- rangeAxis.setTickLabelFont(yfont);
- }
- JFreeChart 柱状图参数设置方法
- JFreeChart 柱状图参数设置方法
- jfreeChart柱状图参数设置
- jfreechart柱状图参数设置
- JFreeChart -- 柱状图
- jfreechart柱状图
- JFreeChart--柱状图
- JFreeChart中画柱状图
- JFreeChart 生成柱状图
- JFreeChart柱状图(转)
- jfreechart之柱状图
- JFreeChart: 基本柱状图
- JFreeChart生成柱状图
- JFreeChart生成柱状图
- JFreeChart 笔记(柱状图)
- jfreechart 柱状图 开发实例
- jfreechart的柱状图处理
- JFreeChart的柱状图实现
- IPV6资源列表
- 磁盘格式的问题
- 开源社区 --- 工具集合
- 如何去除点击链接后的虚线框
- 帮忙改改,成功了,但有时候内存泄露严重,自己实在弄不清楚了
- JFreeChart 柱状图参数设置方法
- DateTime总结
- flex中文(zh_CN)本地化应用编译不通过的解决方法
- 敏捷开发-项目管理类的学习资料
- 求助:如何学习VC++
- Jersey 初识
- My Love-letter To Cai III
- ThreadLocal和线程同步机制相比有什么优势呢
- Oracle SQL内置函数大全(一)


