Silverlight中的图表控件visifire的使用
来源:互联网 发布:ubuntu sdl 安装 编辑:程序博客网 时间:2024/05/22 16:06
Silverlight对于图形图像处理方面,从1.0时代起就给予了很强大的支持,所以我们可以在Silverlight中实现非常棒的各种统计图表,然而现在有了一些开源的项目,使得这项工作更加的简单。
一、下载dll文件,下载地址:http://download.csdn.net/source/3476757
二、解压文件,新建一个Silverlight项目,将其中的Silverlight Binaries下的dll文件引用到Bin目录下。
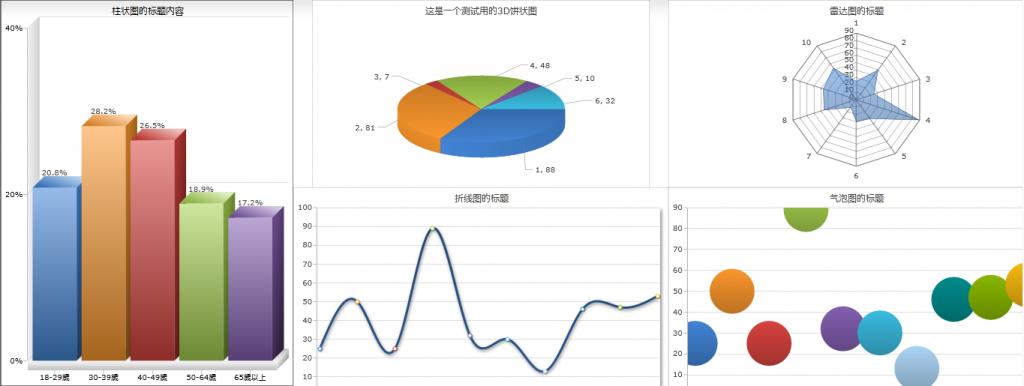
三、支持多种图表类型,Column、Bar、Line、Stock、Bubble、Radar等等几十种类型。
四、贴上代码,如下:
<navigation:Page x:Class="XTExhibition.Views.VisifireCharts" xmlns="http://schemas.microsoft.com/winfx/2006/xaml/presentation" xmlns:x="http://schemas.microsoft.com/winfx/2006/xaml" xmlns:d="http://schemas.microsoft.com/expression/blend/2008" xmlns:mc="http://schemas.openxmlformats.org/markup-compatibility/2006" xmlns:vc="clr-namespace:Visifire.Charts;assembly=SLVisifire.Charts" mc:Ignorable="d" xmlns:navigation="clr-namespace:System.Windows.Controls;assembly=System.Windows.Controls.Navigation" d:DesignWidth="1200" d:DesignHeight="680" Title="VisifireCharts Page"> <Grid x:Name="LayoutRoot"> <StackPanel Orientation="Horizontal" > <!--第一個Chart--> <vc:Chart Grid.Row="0" Name="chtChartOne" Width="390"> <vc:Chart.AxesY> <!--Y間隔--> <vc:Axis Interval="20" Suffix="%"/> </vc:Chart.AxesY> </vc:Chart> <StackPanel> <Grid x:Name="ChartPanel" Height="250" Width="500"> </Grid> <Grid x:Name="ChartLine" Height="300" Width="500"> </Grid> </StackPanel> <StackPanel> <Grid x:Name="Chart1" Height="250" Width="500"> </Grid> <Grid x:Name="Chart2" Height="300" Width="500"> </Grid> </StackPanel> </StackPanel> <!--第二個Chart--> <!--<vc:Chart Grid.Row="1" Name="chtChartTwo"> <vc:Chart.AxesY> <vc:Axis Interval="20" Suffix="%"/> </vc:Chart.AxesY> <vc:Chart.Series> <vc:DataSeries RenderAs="Column" LabelEnabled="true" LabelStyle="OutSide"> <vc:DataSeries.DataPoints> <vc:DataPoint AxisXLabel="18-29歲" YValue="31.2"/> <vc:DataPoint AxisXLabel="30-39歲" YValue="50.3"/> <vc:DataPoint AxisXLabel="40-49歲" YValue="50.9"/> <vc:DataPoint AxisXLabel="50-64歲" YValue="35.6"/> <vc:DataPoint AxisXLabel="65歲以上" YValue="27.6"/> </vc:DataSeries.DataPoints> </vc:DataSeries> </vc:Chart.Series> </vc:Chart>--> </Grid></navigation:Page>
using System;using System.Collections.Generic;using System.Linq;using System.Net;using System.Windows;using System.Windows.Controls;using System.Windows.Documents;using System.Windows.Input;using System.Windows.Media;using System.Windows.Media.Animation;using System.Windows.Shapes;using System.Windows.Navigation;using Visifire.Charts;namespace XTExhibition.Views{ public partial class VisifireCharts : Page { public VisifireCharts() { InitializeComponent(); //柱状图 InitPage(); //饼图 ShowPie(); //折线图 ShowLine(); //雷达图 ShowRadar(); //气泡图 ShowBubble(); } #region 柱状图示例 public void InitPage() { chtChartOne.View3D = true; Title title = new Title(); title.Text = "柱状图的标题内容"; chtChartOne.Titles.Add(title); //統計資料列 DataSeries ds = new DataSeries(); //柱状类型 ds.RenderAs = RenderAs.StackedColumn; //顯示Lable ds.LabelStyle = LabelStyles.OutSide; ds.LabelEnabled = true; //欄 ds.DataPoints.Add(new DataPoint() { AxisXLabel = "18-29歲", YValue = 20.8 }); ds.DataPoints.Add(new DataPoint() { AxisXLabel = "30-39歲", YValue = 28.2 }); ds.DataPoints.Add(new DataPoint() { AxisXLabel = "40-49歲", YValue = 26.5 }); ds.DataPoints.Add(new DataPoint() { AxisXLabel = "50-64歲", YValue = 18.9 }); ds.DataPoints.Add(new DataPoint() { AxisXLabel = "65歲以上", YValue = 17.2 }); chtChartOne.Series.Add(ds); } #endregion #region 饼状图示例 public void ShowPie() { Chart chart = new Chart(); chart.Width = 450; chart.Height = 300; chart.View3D = true; //3D效果 //饼状图的标题设置 Title title = new Visifire.Charts.Title(); title.Text = "这是一个测试用的3D饼状图"; chart.Titles.Add(title); DataSeries dataSeries = new DataSeries(); dataSeries.RenderAs = RenderAs.Pie; dataSeries.LegendText = ""; DataPoint point; int numberOfDataPoints = 6; Random random = new Random(); for (int i = 0; i < numberOfDataPoints; i++) { point = new DataPoint(); point.YValue = random.Next(1, 100); dataSeries.DataPoints.Add(point); } chart.Series.Add(dataSeries); this.ChartPanel.Children.Add(chart); } #endregion #region 折线图示例 public void ShowLine() { Chart chart = new Chart(); //折线图的标题 Title title = new Title(); title.Text = "折线图的标题"; chart.Titles.Add(title); //设置类型为折线图 DataSeries dataSeries = new DataSeries(); dataSeries.RenderAs = RenderAs.Spline; dataSeries.LegendText = "X坐标"; //设置点 DataPoint point; Random random = new Random(); for (int i = 0; i < 10; i++) { point = new DataPoint(); point.YValue = random.Next(1,100); dataSeries.DataPoints.Add(point); } chart.Series.Add(dataSeries); this.ChartLine.Children.Add(chart); } #endregion #region 雷达图示例 public void ShowRadar() { Chart chart = new Chart(); //雷达图的标题 Title title = new Title(); title.Text = "雷达图的标题"; chart.Titles.Add(title); //设置类型为雷达图 DataSeries dataSeries = new DataSeries(); dataSeries.RenderAs = RenderAs.Radar; dataSeries.LegendText = "X坐标"; //设置点 DataPoint point; Random random = new Random(); for (int i = 0; i < 10; i++) { point = new DataPoint(); point.YValue = random.Next(1,100); dataSeries.DataPoints.Add(point); } chart.Series.Add(dataSeries); this.Chart1.Children.Add(chart); } #endregion #region 气泡图示例 public void ShowBubble() { Chart chart = new Chart(); //气泡图的标题 Title title = new Title(); title.Text = "气泡图的标题"; chart.Titles.Add(title); //设置类型为气泡图 DataSeries dataSeries = new DataSeries(); dataSeries.RenderAs = RenderAs.Bubble; dataSeries.LegendText = "X坐标"; //设置点 DataPoint point; Random random = new Random(); for (int i = 0; i < 10; i++) { point = new DataPoint(); point.YValue = random.Next(1, 100); dataSeries.DataPoints.Add(point); } chart.Series.Add(dataSeries); this.Chart2.Children.Add(chart); } #endregion // 当用户导航到此页面时执行。 protected override void OnNavigatedTo(NavigationEventArgs e) { } }}五、效果图如下:
- Silverlight中的图表控件visifire的使用
- SilverLight图表控件 Visifire
- Silverlight 的图表控件 Visifire 的疑问
- SilverLight-Visifire图表控件简单应用
- WPF Visifire图表控件使用基础
- visifire笔记 - 图表控件
- 使用Visifire+ArcGIS API for Silverlight实现Graphic信息的动态图表显示
- silverlight visifire 图表辅助类
- silverlight Visifire图表转图片--偷天换日的做法
- Visifire WPF 图表控件 破解
- Silverlight Visifire控件应用去水印
- Silverlight 使用Visifire Chart 展示统计图
- WindowsPhone统计图表控件 - 第三方控件visifire
- Silverlight图表控件
- Silverlight图表控件(二)
- 初识visifire图表
- 在ASP中使用Office2000中的图表控件的方法
- 关于微软C#中的Chart图表控件的简单使用
- js获取浏览器基本信息:document.body.clientWidth/clientHeight/scrollWidth/scrollTop。
- loadruner 8
- hive学习(转载)
- web service
- 你是不是心累了呢
- Silverlight中的图表控件visifire的使用
- 正则表达式入门经典(学习笔记五)——正则表达式中的圆括号
- MyBatis 中调用存储过程
- WebKit之WebCore
- 付丽叶变换图求水平线的斜率
- container_of()宏的简要解析
- Acer 4630z成功装东皇MacOS10.6.5
- 简单的Makefile实例
- tga文件解析