flot 坐标刻度 改变显示角度
来源:互联网 发布:产品数据管理软件pdm 编辑:程序博客网 时间:2024/04/28 02:13
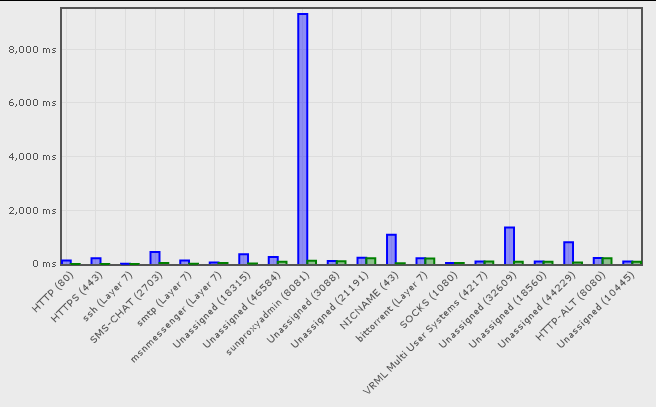
当flot图表大小一致但是 刻度值是一个比较长的数字时会出现刻度值相互重叠的现象。
为了能够不重叠的显示刻度数值,我们需要对原有的flot进行修改,添加一个labelAngle
参数来修改lable的角度。修改完成后效果如下:
参考资料:
http://code.google.com/p/flot/issues/detail?id=85#c20
下面是对flot的补丁文件,应该可以在Linux系统中运行。
主要步骤:
+后面是要添加的语句,-后面是要删除的语句
1、找到flot文件夹下的API.txt文件进行修改。
2、在flot/examples文件夹下找到或者建立一个文件:test-vert.html 然后进行修改。
3、在flot文件夹下找到jquery.flot.js文件进行修改。
注意:支持IE6+,FF3.5,Chrome1.0,Opera 10.5。 在IE9中工作不正常,请在html文件中添加如下代码:(如果背景颜色不是白色请根据实际颜色进行修改)
.tickLabel { background-color:White; color:black; }补丁文件:
diff --git a/API.txt b/API.txtindex 7714723..6d9f0ce 100644--- a/API.txt+++ b/API.txt@@ -193,6 +193,7 @@ Customizing the axes labelWidth: null or number labelHeight: null or number+ labelAngle: number tickLength: null or number @@ -327,7 +328,9 @@ an example of a custom formatter: "labelWidth" and "labelHeight" specifies a fixed size of the tick labels in pixels. They're useful in case you need to align several-plots.+plots. "labelAngle" specifies what angle the labels should be drawn+at. This is especially useful for x-axes where longer labels tend to+overlap. You can use angles between -90 and 90 degrees. "tickLength" is the length of the tick lines in pixels. By default, the innermost axes will have ticks that extend all across the plot, whilediff --git a/examples/test-vert.html b/examples/test-vert.htmlnew file mode 100644index 0000000..6dedcee--- /dev/null+++ b/examples/test-vert.html@@ -0,0 +1,80 @@+<!DOCTYPE HTML PUBLIC "-//W3C//DTD HTML 4.01 Transitional//EN" "http://www.w3.org/TR/html4/loose.dtd">+<html>+<head>+ <meta http-equiv="Content-Type" content="text/html; charset=utf-8">+ <title>Flot Examples</title>+ <link href="layout.css" rel="stylesheet" type="text/css"></link>+ <!--[if IE]><script language="javascript" type="text/javascript" src="../excanvas.min.js"></script><![endif]-->+ <script language="javascript" type="text/javascript" src="../jquery.js"></script>+ <script language="javascript" type="text/javascript" src="../jquery.flot.js"></script>+ <script language="javascript">+ $(document).ready(function(){+ var income = [[0, 310.00], [1, 417.99], [2, 3228.12], [3, 1945.14], [4, 2065.20], [5, 2444.27], [6, 2327.58], [7, 1823.28]];+ var series = [+ {+ data: income,+ color: 'blue',+ label: 'Income',+ bars: {+ show: true,+ barWidth: 0.3,+ align: 'center'+ }}+ ];++ function rotateGraphs(){+ $.plot($("#xbottom"), series , {+ xaxis: {+ tickFormatter: function(v) {+ var r='';+ for (var i=0;i<v;i++){+ r+=i;+ }+ return r;+ },+ labelAngle:$('#angle').val()+ }, + yaxis: {+ labelAngle:$('#angle').val()+ }+ });+ $.plot($("#xtop"), series , {+ xaxis: {+ tickFormatter: function() {+ return 'Long Format is Long';+ },+ labelAngle:$('#angle').val(),+ position:'top'+ },+ yaxis: {+ position:'right',+ labelAngle:$('#angle').val()+ }+ });+ }+ + $('#rotate').click(function(){+ rotateGraphs();+ });++ rotateGraphs();++ });++ </script>+ <style>+ .tickLabel {+ background-color:blue;+ color:white;+ opacity:0.5;+ filter:alpha(opacity=50);+ }+ </style>+</head>+<body>+Angle: <input type="text" value="-90" id="angle"> <input type="button" id="rotate" value="rotate">+<div id="xbottom" style="background-color:lightblue;width:600px;height:300px"></div>+<br><br>+<div id="xtop" style="background-color:lightblue;width:600px;height:300px"></div>+</body>+</html>diff --git a/jquery.flot.js b/jquery.flot.jsindex 3bba69b..b52390e 100644--- a/jquery.flot.js+++ b/jquery.flot.js@@ -64,6 +64,7 @@ tickFormatter: null, // fn: number -> string labelWidth: null, // size of tick labels in pixels labelHeight: null,+ labelAngle: 0, // an angle from 90 to -90 tickLength: null, // size in pixels of ticks, or "full" for whole line alignTicksWithAxis: null, // axis number or null for no sync @@ -77,6 +78,7 @@ }, yaxis: { autoscaleMargin: 0.02,+ labelAngle: 0, // an angle from 90 to -90 position: "left" // or "right" }, xaxes: [],@@ -803,6 +805,129 @@ } } + //in order to move the labels after they have been rotated, we need to know some+ //things about the dimensions of it. This is made harder by the fact that IE+ //"fixes" the post-rotation div. What it does is do the rotation, and then + //move the result back into the original div. All the CSS3-supporting browsers+ //do the rotation and then flow everything else around the original element.+ //Also, the div width and height aren't consistently changed between browsers,+ //so we have to calculate those too (even though the *display* of them is all+ //the same).+ function calculateRotatedDimensions(width,height,angle){+ if (!angle)+ return {};+ var rad = angle * Math.PI / 180,+ sin = Math.sin(rad),+ cos = Math.cos(rad);++ var x1 = cos * width,+ y1 = sin * width;+ var x2 = -sin * height,+ y2 = cos * height;+ var x3 = cos * width - sin * height,+ y3 = sin * width + cos * height;+ var minX = Math.min(0, x1, x2, x3),+ maxX = Math.max(0, x1, x2, x3),+ minY = Math.min(0, y1, y2, y3),+ maxY = Math.max(0, y1, y2, y3);++ //next figure out the x,y locations of certain points on the rotated+ //rectangle+ //specifically, if our rectangle is defined by (0 ,0),(w,0),(w ,-h ),(-h,0)+ //for negative angles:+ // -we need to know where (-h',0'), as it is the left-most point+ // -we need to know where (-h/2',0') is , for center alignment+ // -and the same for the right side - (w',0') and (w',-h/2')+ var aligned_left = { x: height/2 * sin, y: height/2 * cos};+ var aligned_right = {x: (width*cos + height/2*sin), y: (width*sin - height/2*cos)};//(w',-h/2')+ var topmost,bottommost,leftmost;+ if (angle < 0){+ bottommost = { x: (width*cos + height*sin), y:(width*sin - height*cos)};//(w',-h')+ leftmost = { x: height * sin, y: height * cos};+ } else {+ topmost = { x: x1, y: y1};//(w',0)+ bottommost = { x: height * sin, y: -height*cos};//(0',-h')+ }++ return { width: (maxX-minX), height: (maxY - minY), + a_left:aligned_left, a_right:aligned_right,+ topmost:topmost,bottommost:bottommost,+ leftmost:leftmost};+ }++ // For the given axis, determine what offsets to place the labels assuming+ // that they are angled instead of centered on the tick+ // for top/bottom positioned axes, this returns the fixed top and also+ // a left offset from the tick+ // for left/right axes, a fixed left and a top offset+ function calculateAxisAngledLabels(axis){+ var angle = axis.options.labelAngle;+ if (angle == 0)+ return {}; + var box = axis.box;+ var dims = calculateRotatedDimensions(axis.options.origWidth,axis.options.origHeight,angle);+ var align = "left";+ var oLeft=0, oTop=0, top, left;++ if (axis.position == 'bottom'){+ top = box.top + box.padding;+ if (angle < 0) {+ if (!$.browser.msie)+ oLeft = -dims.a_left.x;+ else+ oLeft = dims.a_left.x;+ } else {+ align = "right";+ oLeft = -dims.a_right.x;+ if (!$.browser.msie)+ top += dims.topmost.y;+ }+ } else if (axis.position == 'top') {+ top = box.top; + if (!$.browser.msie && angle > 0)+ top += box.height - box.padding + dims.bottommost.y;++ if (angle < 0)+ align = "right";+ if ($.browser.msie && angle < 0){+ oLeft = -dims.width - dims.a_left.x;+ } else {+ if (angle < 0)+ oLeft = -dims.a_right.x;+ else + oLeft = -dims.a_left.x;+ }+ } else if (axis.position == 'left') {+ align = "right";+ left = box.left;+ if (angle < 0) {+ oTop = dims.a_right.y;+ if (!$.browser.msie)+ left -= dims.leftmost.x;+ } else {+ if ($.browser.msie)+ oTop = -dims.a_left.y;+ else+ oTop = dims.a_right.y;+ }+ } else if (axis.position == 'right') {+ align = "left";+ left = box.left + box.padding;+ if (angle < 0) {+ if (!$.browser.msie)+ left -= dims.leftmost.x;+ oTop = -dims.a_left.y;+ } else {+ if ($.browser.msie)+ oTop = -dims.height + dims.a_left.y;+ else+ oTop = -dims.a_left.y;+ }+ }++ return {top: top, left: left, oTop: oTop, oLeft: oLeft, align: align };+ }+ function measureTickLabels(axis) { if (!axis) return;@@ -817,7 +942,7 @@ .appendTo(placeholder); } - if (axis.direction == "x") {+ if (axis.direction == "x" && axis.options.labelAngle == 0) { // to avoid measuring the widths of the labels (it's slow), we // construct fixed-size boxes and put the labels inside // them, we don't need the exact figures and the@@ -854,10 +979,23 @@ if (labels.length > 0) { dummyDiv = makeDummyDiv(labels, "");- if (w == null)- w = dummyDiv.children().width();- if (h == null)- h = dummyDiv.find("div.tickLabel").height();+ if (axis.options.labelAngle != 0){+ var dims = calculateRotatedDimensions(+ dummyDiv.children().width(),+ dummyDiv.find("div.tickLabel").height(),+ axis.options.labelAngle);+ axis.options.origHeight = dummyDiv.find("div.tickLabel").height();+ axis.options.origWidth = dummyDiv.children().width();+ if (h == null)+ h = dims.height;+ if (w == null)+ w = dims.width;+ } else {+ if (w == null)+ w = dummyDiv.children().width();+ if (h == null)+ h = dummyDiv.find("div.tickLabel").height();+ } dummyDiv.remove(); } }@@ -866,7 +1004,7 @@ w = 0; if (h == null) h = 0;- + axis.labelWidth = w; axis.labelHeight = h; }@@ -1609,7 +1747,30 @@ ctx.restore(); } + function insertAxisLabels() {+ var addRotateLabelStyles = function(styles,axis){+ var b = '';+ if ($.browser.safari || $.browser.webkit)+ b = 'webkit';+ else if ($.browser.mozilla)+ b = 'moz';+ else if ($.browser.opera)+ b = 'o';+ //flip the angle so IE/non-IE do the same thing+ styles.push("-"+b+"-transform:rotate("+-axis.options.labelAngle+"deg)");+ styles.push("-"+b+"-transform-origin:top left");+ }++ if ($.browser.msie) + addRotateLabelStyles = function(styles,axis) {+ var rad = axis.options.labelAngle * Math.PI / 180,+ cos = Math.cos(rad),+ sin = Math.sin(rad);+ + styles.push("filter:progid:DXImageTransform.Microsoft.Matrix(M11="+cos+", M12="+sin+", M21="+(-sin)+", M22="+cos+",sizingMethod='auto expand'");+ }+ placeholder.find(".tickLabels").remove(); var html = ['<div class="tickLabels" style="font-size:smaller">'];@@ -1617,6 +1778,7 @@ var axes = getUsedAxes(); for (var j = 0; j < axes.length; ++j) { var axis = axes[j], box = axis.box;+ var angledPos = calculateAxisAngledLabels(axis); //debug: html.push('<div style="position:absolute;opacity:0.10;background-color:red;left:' + box.left + 'px;top:' + box.top + 'px;width:' + box.width + 'px;height:' + box.height + 'px"></div>') html.push('<div class="' + axis.direction + 'Axis ' + axis.direction + axis.n + 'Axis" style="color:' + axis.options.color + '">'); for (var i = 0; i < axis.ticks.length; ++i) {@@ -1627,30 +1789,47 @@ var pos = {}, align; if (axis.direction == "x") {- align = "center";- pos.left = Math.round(plotOffset.left + axis.p2c(tick.v) - axis.labelWidth/2);- if (axis.position == "bottom")- pos.top = box.top + box.padding;- else- pos.bottom = canvasHeight - (box.top + box.height - box.padding);- }- else {- pos.top = Math.round(plotOffset.top + axis.p2c(tick.v) - axis.labelHeight/2);- if (axis.position == "left") {- pos.right = canvasWidth - (box.left + box.width - box.padding)- align = "right";+ if (axis.options.labelAngle != 0){+ align = angledPos.align;+ pos.left = Math.round(plotOffset.left + axis.p2c(tick.v));+ pos.left += angledPos.oLeft;+ pos.top = angledPos.top;+ } else {+ align = "center";+ pos.left = Math.round(plotOffset.left + axis.p2c(tick.v) - axis.labelWidth/2);+ if (axis.position == "bottom")+ pos.top = box.top + box.padding;+ else+ pos.bottom = canvasHeight - (box.top + box.height - box.padding); }- else {- pos.left = box.left + box.padding;- align = "left";+ } + else {+ if (axis.options.labelAngle != 0){+ align = angledPos.align;+ pos.top = Math.round(plotOffset.top + axis.p2c(tick.v));+ pos.top += angledPos.oTop;+ pos.left = angledPos.left;+ } else {+ pos.top = Math.round(plotOffset.top + axis.p2c(tick.v) - axis.labelHeight/2);+ if (axis.position == "left") {+ pos.right = canvasWidth - (box.left + box.width - box.padding)+ align = "right";+ }+ else {+ pos.left = box.left + box.padding;+ align = "left";+ } } } - pos.width = axis.labelWidth;+ pos.width = (axis.options.labelAngle != 0)?axis.options.origWidth:axis.labelWidth; var style = ["position:absolute", "text-align:" + align ]; for (var a in pos) style.push(a + ":" + pos[a] + "px")++ if (axis.options.labelAngle != 0)+ addRotateLabelStyles(style,axis); html.push('<div class="tickLabel" style="' + style.join(';') + '">' + tick.label + '</div>'); }修改完成后在自己的flot文件中使用labelAngle属性即可。- flot 坐标刻度 改变显示角度
- matlab作图如何改变坐标刻度
- 调整坐标中日期刻度的显示
- flot画曲线坐标
- 如何改变sencha-chart的刻度item显示文字
- MATLAB画图:改变坐标轴刻度的显示数值
- MATLAB画图技巧:改变坐标轴刻度的显示数值
- 调整坐标刻度
- flot 自定义显示日期
- flot 自定义显示日期
- origin设置坐标刻度标签
- Matlab基础之plot、plotyy的格式设置(坐标,刻度,坐标值,不均匀的坐标轴显示)
- 如何改变matlab刻度范围,如果改变坐标轴刻度字体大小
- Android带刻度的可选角度进度条
- flot柱状图上显示数字
- Flot柱状图如何并列显示
- matlab坐标刻度调整>>SimWe仿真论坛
- gnuplot 坐标取值范围及刻度
- 【学习笔记】类的继承
- eclipse中如何把源码打进jar包(创建有源码的jar包,或者有源码如何在eclipse中查看)
- Android完全退出应用程序的方法
- 2、ubuntu中man不能查询函数的解决方法
- 3、如何设置SecureCRT的字体及背景颜色
- flot 坐标刻度 改变显示角度
- 请先给自己戴好氧气面罩
- list去除重复数据
- 做程序员喜欢的测试
- 苦命男人之必读---爱妻守则50条
- 3、进程间7种通信方式
- int(*p)[2] 与 int *p[2] 的区别
- kerberos安装配置
- 4、如何新增与删除磁盘分区