Latent Semantic Analysis (LSA) Tutorial 潜语义分析LSA介绍 六
来源:互联网 发布:简单的php网页 编辑:程序博客网 时间:2024/05/01 16:14
Part 4 - Clustering by Color
用颜色聚类
We can also turnthe numbers into colors. For instance, here is a color display that correspondsto the first 3 dimensions of the Titles matrix that we showed above. Itcontains exactly the same information, except that blue shows negative numbers,red shows positive numbers, and numbers close to 0 are white. For example,Title 9, which is strongly positive in all 3 dimensions, is also strongly redin all 3 dimensions.
我们可以把数字转换为颜色。例如,下图表示了标题矩阵3个维度的颜色分布。除了蓝色表示负值,红色表示正值,它包含了和矩阵同样的信息。例如,标题9在所有三个维度上正数值都较大,那么它在3个维度上都会很红。
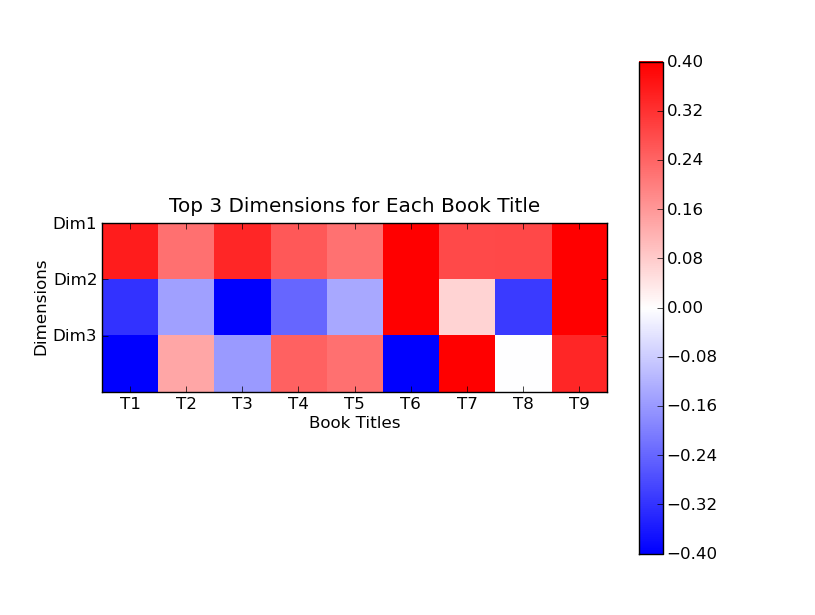
We can use thesecolors to cluster the titles. We ignore the first dimension for clusteringbecause all titles are red. In the second dimension, we have the followingresult.
我们能够利用这些颜色来把标题聚类。我们在聚类中忽略第一维度,因为所有的都是红色。在第二维度,我们有如下结果:
Dim2
Titles
red
6-7, 9
blue
1-5, 8
Using the thirddimension, we can split each of these groups again the same way. For example,looking at the third dimension, title 6 is blue, but title 7 and title 9 arestill red. Doing this for both groups, we end up with these 4 groups.
在加上第三维度,我们可以继续划分。例如,在维度3上,标题6是蓝色,但是标题7和标题9依然是红色。最终我们得到如下几个分组:
Dim2
Dim3
Titles
red
red
7, 9
red
blue
6
blue
red
2, 4-5, 8
blue
blue
1, 3
It’s interestingto compare this table with what we get when we graph the results in the nextsection.
Part 5 - Clustering by Value
按值聚类
Leaving out thefirst dimension, as we discussed, let's graph the second and third dimensionsusing a XY graph. We'll put the second dimension on the X axis and the thirddimension on the Y axis and graph each word and title. It's interesting tocompare the XY graph with the table we just created that clusters thedocuments.
去掉维度1,让我们用xy轴坐标图来画出第二维和第三维。第二维作为X、第三维作为Y,并且把每个词和标题都画上去。比较下这个图和刚才聚类的表格会非常有意思。
In the graphbelow, words are represented by red squares and titles are represented by bluecircles. For example the word "book" has dimension values (0.15,-0.27, 0.04). We ignore the first dimension value 0.15 and graph"book" to position (x = -0.27, y = 0.04) as can be seen in the graph.Titles are similarly graphed.
在下图中,词表示为红色方形,标题表示为蓝色圆圈。例如,词“book”有坐标值(0.15, -0.27,0.04)。这里我们忽略第一维度0.15 把点画在(x = -0.27, y =0.04)。标题也是一样。
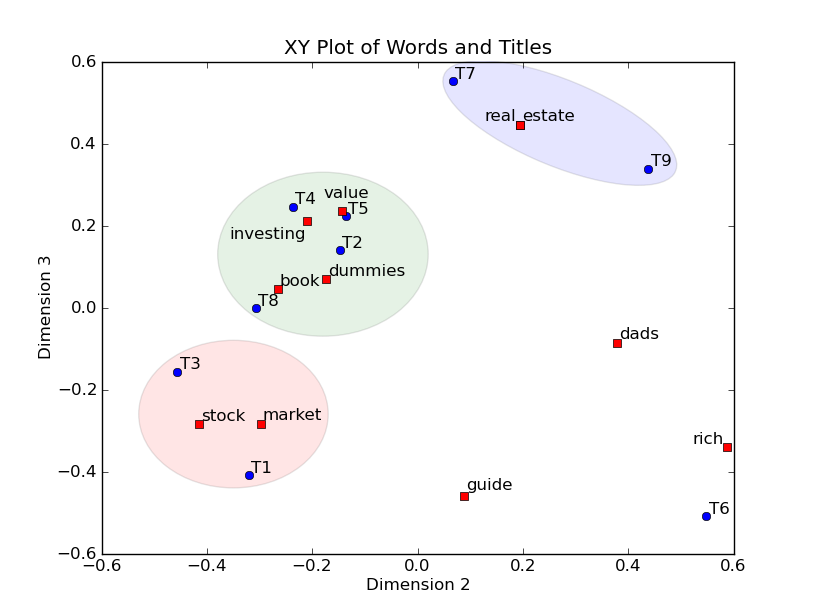
One advantage ofthis technique is that both words and titles are placed on the same graph. Notonly can we identify clusters of titles, but we can also label the clusters bylooking at what words are also in the cluster. For example, the lower leftcluster has titles 1 and 3 which are both about stock market investing. Thewords "stock" and "market" are conveniently located in thecluster, making it easy to see what the cluster is about. Another example isthe middle cluster which has titles 2, 4, 5, and, to a somewhat lesser extent,title 8. Titles 2, 4, and 5 are close to the words "value" and"investing" which summarizes those titles quite well.
这个技术的一个有点是词和标题都在一张图上。不仅我们可以区分标题的聚类,而且我们可以把聚类中的词给这个聚类打上标签。例如左下的聚类中有标题1和标题3都是关于股票市场投资(stock market investing)的。Stock和market可以方便的定位在这个聚类中,让描述这个聚类变得容易。其它也类似。
- Latent Semantic Analysis (LSA) Tutorial 潜语义分析LSA介绍 六
- Latent Semantic Analysis (LSA) Tutorial 潜语义分析LSA介绍 一
- Latent Semantic Analysis (LSA) Tutorial 潜语义分析LSA介绍 二
- Latent Semantic Analysis (LSA) Tutorial 潜语义分析LSA介绍 三
- Latent Semantic Analysis (LSA) Tutorial 潜语义分析LSA介绍 四
- Latent Semantic Analysis (LSA) Tutorial 潜语义分析LSA介绍 五
- Latent Semantic Analysis (LSA) Tutorial 潜语义分析LSA介绍 七
- Latent Semantic Analysis (LSA) Tutorial 潜语义分析LSA介绍 (转)
- Latent Semantic Analysis (LSA) Tutorial 潜语义分析LSA介绍 一
- Latent Semantic Analysis (LSA) Tutorial 潜语义分析LSA介绍 二
- Latent Semantic Analysis (LSA) Tutorial 潜语义分析LSA介绍 三
- Latent Semantic Analysis (LSA) Tutorial 潜语义分析LSA介绍 四
- 【译】潜在语义分析Latent Semantic Analysis (LSA)
- Latent semantic analysis (LSA)
- Latent Semantic Analysis(LSA)
- Latent Semantic Analysis(LSA)
- Latent semantic analysis note(LSA)
- Latent semantic analysis note(LSA)
- 简明Vim练级攻略
- 软件设计与软件工程
- xml规则
- 9.20课下总结Panel、Table、BulletedList控件的使用
- UML图中的其他几种图(时序图,协作图,状态图,活动图,对象图)
- Latent Semantic Analysis (LSA) Tutorial 潜语义分析LSA介绍 六
- 给程序员的Vim速查卡
- 黑马程序员-java异常处理
- 计算机视觉领域的一些牛人博客,超有实力的研究机构等的网站链接
- UML
- 对jQuery的初步认识
- xml基础2
- UML 各种图
- 主题数据库