Getting Started with igGrid, OData, and WCF Data Services
来源:互联网 发布:淘宝装修代码生成器 编辑:程序博客网 时间:2024/04/29 22:52
原文:http://blogs.infragistics.com/blogs/engineering/archive/2011/07/28/getting-started-with-iggrid-odata-and-wcf-data-services.aspx
The igGrid is a client-side data grid with paging, filtering, and sorting functionality. It can bind to local data including XML, JSON, JavaScript arrays, HTML tables and remote data returned through web services.
The most seamless way to bind the igGrid to remote data is to use it in conjunction with OData. OData, or Open Data Protocol, operates over HTTP and provides a means of querying and updating data in JSON and AtomPub formats through a set of common URL conventions. This means that you can provide the grid with a URL to the OData service, set one property, and all of the paging, filtering, and sorting can be done remotely on the server without any additional configuration.
This article shows how to setup a client-side jQuery grid with remote paging, filtering, and sorting by setting up a WCF Data Service in an ASP.NET Web Application and setting two options on the igGrid.
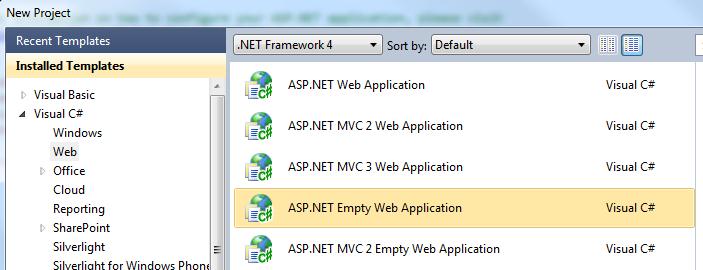
1. Open Visual Studio and create a new ASP.NET Empty Web Application called ‘igDataSourceWCFService’:
Note: this is a plain old ASP.NET Web Application – this is not ASP.NET MVC. NetAdvantage for jQuery is ‘server agnostic’, meaning it does not rely on any specific server-side architecture. While the product ships with built-in support for ASP.NET MVC, this server framework is not required to use the rich client-side functionality.
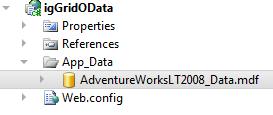
2. Add an App_Data folder to your project and add the AdventureWorks database into that folder:
Note: To obtain the AdventureWorks database, download it here.
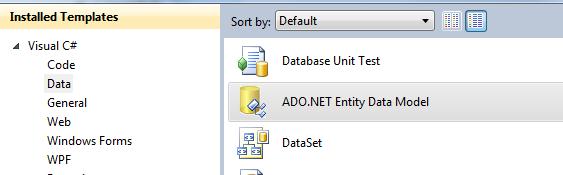
3. Next, add an ADO.NET Entity Data Model named AdventureWorksEntities.edmx to the project and point it to the AdventureWorks database:
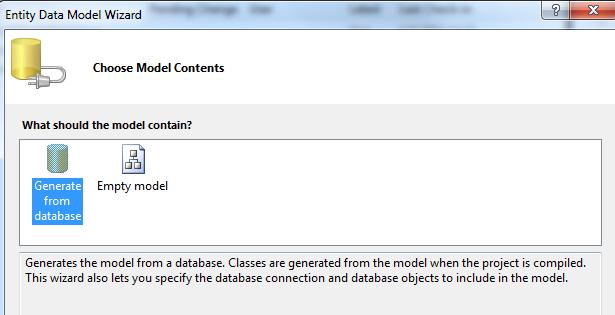
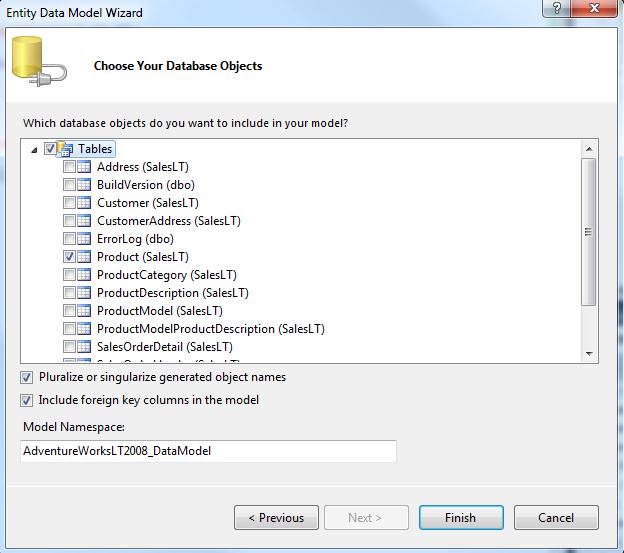
4. Choose the Product table to be included in the Entity Data Model:
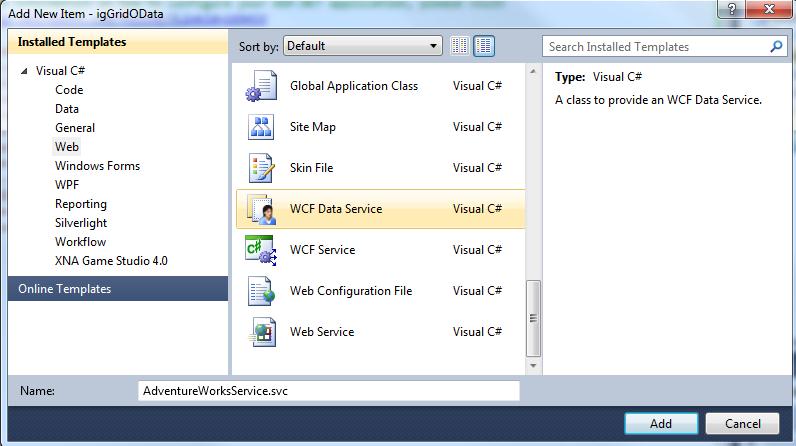
5. Next add a WCF Data Service to the project named ‘AdventureWorksService.svc’:
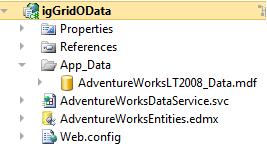
6. At this point your project should look like this:
7. Next, open the ‘AdventureWorksDataService’. This class derives from DataService<T> where T has not yet been defined. Specify the type of your Entity Data Model here:
- public class AdventureWorksDataService : DataService<AdventureWorksLT2008_DataEntities>
8. Next, enable access to the Products table through the Data Service by adding this line of code within the InitializeService method:
- public static void InitializeService(DataServiceConfiguration config
- {
- config.SetEntitySetAccessRule("Products", EntitySetRights.AllRead);
- config.DataServiceBehavior.MaxProtocolVersion = DataServiceProtocolVersion.V2;
- }
9. WCF Data Services has native support for the Atom format. To enable JSON formatted data, you should download theJSONPSupportBehavior code file and include it in your application.
10. Once the JSONPSupportBehavior.cs file is included in your application, make sure to change the namespace to match the namespace used in your application. Also, add the JSONPSupportBehavior attribute to your AdventureWorksDataService class:
- [JSONPSupportBehavior]
- public class AdventureWorksDataService : DataService<AdventureWorksLT2008_DataEntities>
11. At this point, you can run the Web Application and access the data of the service so now it’s time to setup the igGrid.
12. You will need the NetAdvantage for jQuery combined and minified script file, ig.ui.min.js, which comes with the product. In addition, you will need the jQuery, jQuery UI, and jQuery templates scripts to run the sample. Thishelp article discusses referencing the required scripts and where the combined and minified scripts can be found.
Note: You can download the full or trial product here. The jQuery templates script can be obtained here.
13. You should setup a scripts directory in your project and copy the JavaScript files into this folder.
14. Setup a styles directory and add the Infragistics themes directory to this folder. For more information on working with the jQuery themes for the igGrid, seethis help topic.
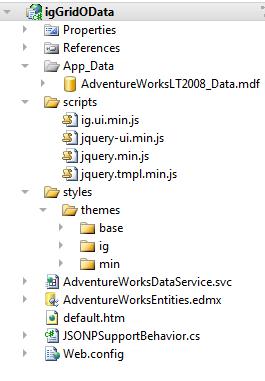
15. Next you can setup the sample page. You are going to add a new html page to the application and call it ‘default.htm’. Once that is done your project will look like this:
16. Open the default.htm file and include CSS links and script tags for the jQuery resources:
- <head>
- <link href="styles/themes/min/ig/jquery.ui.custom.min.css" rel="stylesheet" type="text/css" />
- <link href="styles/themes/base/ig.ui.min.css" rel="stylesheet" type="text/css" />
- <script src="scripts/jquery.min.js" type="text/javascript"></script>
- <script src="scripts/jquery-ui.min.js" type="text/javascript"></script>
- <script src="scripts/jquery.tmpl.min.js" type="text/javascript"></script>
- <script src="scripts/ig.ui.min.js" type="text/javascript"></script>
- </head>
17. Next, add a TABLE element to the body of the HTML which will serve as the base element for the grid:
- <body>
- <table id='tableProducts'></table>
- </body>
18. Add another script tag to the HEAD and instantiate an igGrid and define columns:
- <script type="text/javascript">
- $(window).load(function () {
- $('#tableProducts').igGrid({
- height: '500px',
- width: '800px',
- autoGenerateColumns: false,
- columns: [
- { headerText: 'ID', key: 'ProductID', dataType: 'number' },
- { headerText: 'Name', key: 'Name', dataType: 'string' },
- { headerText: 'Number', key: 'ProductNumber', dataType: 'string' },
- { headerText: 'Cost', key: 'StandardCost', dataType: 'number', format: 'currency'}
- ]
- });
- });
- </script>
19. To bind the igGrid to data, two options should be set to define the URL for the data and the responseDataKey:
Note: The value d.results is a standard response key for JSON data coming from a ‘V2’ OData service
- responseDataKey: 'd.results',
- dataSource: 'AdventureWorksDataService.svc/Products?$format=json',
20. Finally, enable the features of the grid including the option to make them operate remotely:
- features: [
- {
- name: 'Selection',
- mode: 'row',
- multipleSelection: true
- },
- {
- name: 'Paging',
- type: 'remote',
- pageSize: 15
- },
- {
- name: 'Sorting',
- type: 'remote'
- },
- {
- name: 'Filtering',
- type: 'remote',
- mode: 'advanced'
- }
- ]
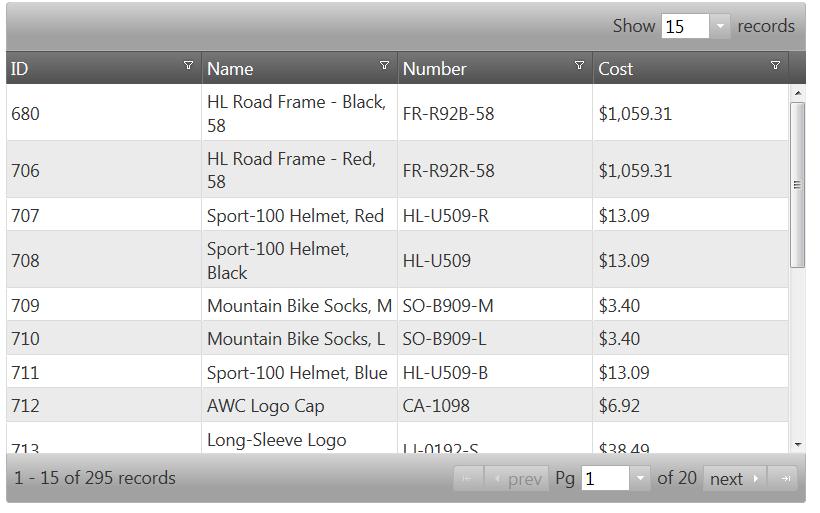
Run the sample and you will see the igGrid rendered. Combined with OData, the grid can filter, sort, and page data remotely by supplying a single URL as the datasource.
- Getting Started with igGrid, OData, and WCF Data Services
- Getting Started With OData Part 2: Building an OData Services from Any Data Source
- Getting Started with Reporting Services
- Getting Started with Data Structures
- WCF Data Services and jQuery(自建grid以odata显示)
- OData v3与WCF Data Services 5.x简介
- [微软官方代码]Getting Started - WCF RIA Services
- Getting Started with Eclipse and the SWT
- Getting Started With Ruby and Rails
- Getting Started With Node.js and mongoDB
- Getting Started with Eclipse and Counterclockwise
- Getting Started with Kinect and Processing
- Getting Started With IronRuby And RSpec
- Getting started with OpenCL and GPU Computing
- Getting started with GWT, Maven and Eclipse
- Getting Started with JPA and Eclipse
- Getting started with OpenCL and GPU Computing
- Getting Started Tutorial WCF
- 今天开通博客,立此文章为证
- 新特性:/dev/shm对oracle 11g的影响
- UILabel教程
- struts2 类型转换器 Date型数据转换
- [iOS创业经验分享]
- Getting Started with igGrid, OData, and WCF Data Services
- 某型号车载单元原理图评审体会
- Build LFS problem sets
- 2011101203
- linux下查看电脑硬件设备属性
- windows下ACE怎样安装与使用说明?
- oracle的表和列取别名
- aspx学习一
- Linux进程间通信(一)——管道、信号量