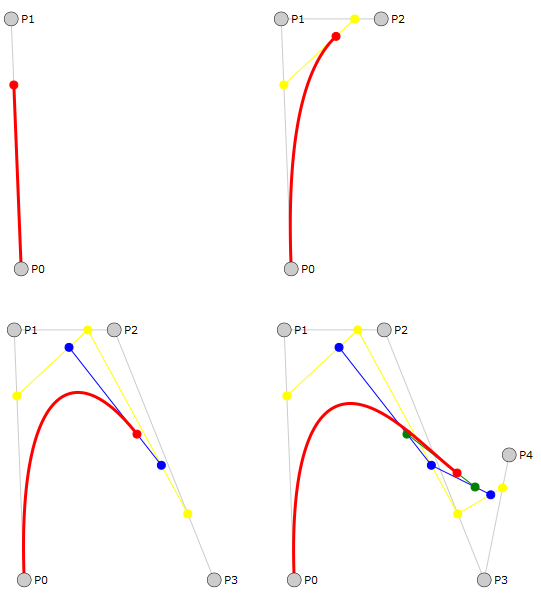
SVG动画演示贝塞尔曲线(1-4阶)绘制过程
来源:互联网 发布:知乎app下载安卓 编辑:程序博客网 时间:2024/06/06 01:48
贝塞尔曲线是我们大陆的叫法,英文名是Bézier Curve,港澳台称为貝茲曲線,新加坡马来西亚称为贝济埃曲线。
先看一下效果图: 点击这里查看动画效果
维基百科中的贝塞尔曲线条目中的几个GIF动画很漂亮,顺路贴上来。


核心Javscript代码:
var w = 250, h = 300, t = .5, delta = .01, padding = 10, points = [{x: 10, y: 250}, {x: 0, y: 0}, {x: 100, y: 0}, {x: 200, y: 250}, {x: 225, y: 125}], bezier = {}, line = d3.svg.line().x(x).y(y), n = 4, orders = d3.range(2, n + 2);var vis = d3.select("body").selectAll("svg") .data(orders) .enter().append("svg:svg") .attr("width", w + 2 * padding) .attr("height", h + 2 * padding) .append("svg:g") .attr("transform", "translate(" + padding + "," + padding + ")");update();vis.selectAll("circle.control") .data(function(d) { return points.slice(0, d) }) .enter().append("svg:circle") .attr("class", "control") .attr("r", 7) .attr("cx", x) .attr("cy", y) .call(d3.behavior.drag() .on("dragstart", function(d) { this.__origin__ = [d.x, d.y]; }) .on("drag", function(d) { d.x = Math.min(w, Math.max(0, this.__origin__[0] += d3.event.dx)); d.y = Math.min(h, Math.max(0, this.__origin__[1] += d3.event.dy)); bezier = {}; update(); vis.selectAll("circle.control") .attr("cx", x) .attr("cy", y); }) .on("dragend", function() { delete this.__origin__; }));vis.append("svg:text") .attr("class", "t") .attr("x", w / 2) .attr("y", h) .attr("text-anchor", "middle");vis.selectAll("text.controltext") .data(function(d) { return points.slice(0, d); }) .enter().append("svg:text") .attr("class", "controltext") .attr("dx", "10px") .attr("dy", ".4em") .text(function(d, i) { return "P" + i });var last = 0;d3.timer(function(elapsed) { t = (t + (elapsed - last) / 5000) % 1; last = elapsed; update();});function update() { var interpolation = vis.selectAll("g") .data(function(d) { return getLevels(d, t); }); interpolation.enter().append("svg:g") .style("fill", colour) .style("stroke", colour); var circle = interpolation.selectAll("circle") .data(Object); circle.enter().append("svg:circle") .attr("r", 4); circle .attr("cx", x) .attr("cy", y); var path = interpolation.selectAll("path") .data(function(d) { return [d]; }); path.enter().append("svg:path") .attr("class", "line") .attr("d", line); path.attr("d", line); var curve = vis.selectAll("path.curve") .data(getCurve); curve.enter().append("svg:path") .attr("class", "curve"); curve.attr("d", line); vis.selectAll("text.controltext") .attr("x", x) .attr("y", y); vis.selectAll("text.t") .text("t=" + t.toFixed(2));}function interpolate(d, p) { if (arguments.length < 2) p = t; var r = []; for (var i=1; i<d.length; i++) { var d0 = d[i-1], d1 = d[i]; r.push({x: d0.x + (d1.x - d0.x) * p, y: d0.y + (d1.y - d0.y) * p}); } return r;}function getLevels(d, t_) { if (arguments.length < 2) t_ = t; var x = [points.slice(0, d)]; for (var i=1; i<d; i++) { x.push(interpolate(x[x.length-1], t_)); } return x;}function getCurve(d) { var curve = bezier[d]; if (!curve) { curve = bezier[d] = []; for (var t_=0; t_<=1; t_+=delta) { var x = getLevels(d, t_); curve.push(x[x.length-1][0]); } } return [curve.slice(0, t / delta + 1)];}function x(d) { return d.x; }function y(d) { return d.y; }function colour(d, i) { return d.length > 1 ? ["#ccc", "yellow", "blue", "green"][i] : "red";}- SVG动画演示贝塞尔曲线(1-4阶)绘制过程
- SVG动画演示贝塞尔曲线(1-4阶)绘制过程
- SVG动画演示贝塞尔曲线(1-4阶)绘制过程
- svg绘制曲线
- Android 属性动画-绘制贝塞尔曲线路径
- matplot 动画 绘制正弦波 曲线
- 通过 de Casteljau 算法绘制贝塞尔曲线,并计算它的切线,实现 1-7 阶贝塞尔曲线的形成动画。
- 利用svg技术实现在线动画演示
- Lissajous曲线动画演示(Matlab实现)
- SVG 贝塞尔曲线学习一
- SVG 贝塞尔曲线学习二
- SVG 贝塞尔曲线学习三
- 贝塞尔曲线与CSS3动画、SVG和canvas的基情
- 贝塞尔曲线与CSS3动画、SVG和canvas的基情
- 贝塞尔曲线与CSS3动画、SVG和canvas的基情
- 贝塞尔曲线与CSS3动画、SVG和canvas的基情
- svg 绘制曲线动态进度条 避免canvas锯齿问题
- Path绘制动态的贝塞尔曲线、PathMeasure来绘制path动画
- HTTP请求的细节
- 2012各大公司的C++试题
- 杂谈:淘宝商城“暴动”事件
- CakePHP: 使用Flickr创建定制的相册和增值服务
- WinForm 分屏 [ WinForm | Panel | 视频监控分屏 ]
- SVG动画演示贝塞尔曲线(1-4阶)绘制过程
- Oracle数据库LONG类型移植
- DataSet
- 循环队列(用顺序表来实现)
- thttpd
- Nginx内核参数相关的优化设定
- 消息机制-WSAAsyncSelect
- 计算机系统操作 操作系统概念第六版
- Running shell commands from Emacs