应用Gnuplot进行数据的可视化 Ubuntu
来源:互联网 发布:免费股票交易软件下载 编辑:程序博客网 时间:2024/04/26 16:50
GNU/Linux提供了进行数据可视化的很多开源解决方案。 这些解决方案不仅能将数据转换成示意图,图表和特定的图像,还能对数据进行过滤和精简以使其更加有用。Gnuplot是最古老的可视化程序之一,也是最好用的。今天在《GNU/LINUX环境编程》中看到了,学习了一下,以下就做个学习笔记吧。
1,安装Gnuplot
如果你的电脑里没有Gnuplot , 可以用以下的命令安装:
sudo apt-get install gnuplot安装完了之后,用命令:gnuplot进入其界面。
2,简单绘图
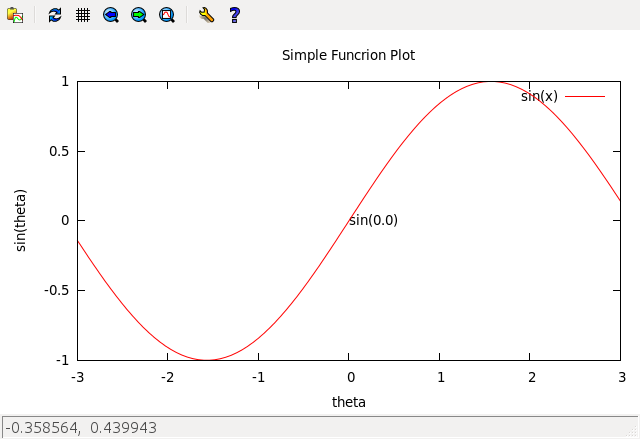
用命令: >plot sin(x)
就可以很轻松地画出sin(x)的图像,这一点很像MATLAB的plot的用法。也可以通过set 来修改图像的一些参数,程序如下:
set title "Simple Funcrion Plot"set xrange [-3 : 3]set yrange [-1 : 1]set xlabel "theta"set ylabel "sin(theta)"set label "sin(0.0)" at 0.0 , 0.0plot sin(x)运行结果如下:
3, 3-D画图 将数据图像保存到文件
set title "A Simple Function to splot" /*标题*/set xrange [-4:4] /*x轴的范围*/set yrange [-4:4] /*y轴的范围*/set ylabel "Y-AXES" /*X轴标记*/set xlabel "X-AXES" /*Y轴标记*/set isosample 40 /*设置图像的栅格线密度,即作图的采样密度*/set hidden /*隐线消除*/set terminal png /*terminal控制输出格式,文件的输出格式*/set output "plot.png" /*指定图像的输出名*/splot sin(x)*cos(y) /*splot 3-D作图函数*/
4,多图模式
/*多图模式,利用layout函数进行分块,类似于:subplot*/set multiplot layout 1 ,2 rowsfirst title "Example Multiplot"set title "Top"set hiddenset isosample 40splot [x=-4:4] [y=-4:4] sin(x)*cos(y)set title "Down"set hidden set isosample 10set xrange [-3 : 3]set yrange [-1 : 1]set xlabel "X"set ylabel "sin(X)"plot sin(x)- 应用Gnuplot进行数据的可视化 Ubuntu
- gnuplot让您的数据可视化
- gnuplot 让您的数据可视化
- gnuplot:让你的数据可视化
- gnuplot 让您的数据可视化
- gnuplot 让您的数据可视化
- gnuplot 让您的数据可视化
- gnuplot 让您的数据可视化
- C++ 结合 gnuplot 实现数据可视化
- IBM:gnuplot 让您的数据可视化 自由控制高级图表和数据绘图
- Ubuntu中利用GNUPLOT画NS3产生的数据
- 数据可视化matplotlib的应用
- 对数据分布进行可视化的方法
- 对数据分布进行可视化的方法
- 利用Excel进行简单的数据可视化
- Gnuplot工具的应用实例
- K-Means++ 聚类之数据可视化:使用gnuplot
- 【数据可视化】地理信息可视化应用
- 自己做了个密钥
- 把Android低版本(如1.5)工程迁移到高版本(如2.2)去
- Python 自动连接ssh
- path1
- 文荣:你在替下属“背猴子”吗
- 应用Gnuplot进行数据的可视化 Ubuntu
- 第一个 Ajax 入门实例
- 任正非:为轮值CEO鸣锣开道
- My weakness
- Java虚拟机KVM在嵌入式Linux上的移植(转)
- Activity跳转页面切换漂亮效果(转)
- JavaBean 成员命名规范
- 开发一个小工具重温C#经典问题
- 展望未来,总结过去10年的程序员生涯,给程序员小弟弟小妹妹们的一些总结性忠告