How do I monitor HTTP communication in Eclipse?
来源:互联网 发布:whois数据库 编辑:程序博客网 时间:2024/05/22 17:43
转自: http://www.avajava.com/tutorials/lessons/how-do-i-monitor-http-communication-in-eclipse.html?page=2
EclipseSW has a TCP/IP Monitor view that comes in very handy if you're interested in watching the HTTP communication between a browser and your web application. Basically, it listens on a port on your machine where Eclipse is running, and it forwards that request on to a destination host and port. TomcatSW typically runs on port 8080 when I fire up a project on my local machine, so I have the TCP/IP Monitor listen on port 8081 and forward the request to port 8080 of the localhost. By listening to 8081 and forwarding to 8080, the TCP/IP Monitor grabs and displays the requests going to the server and the responses coming back from the server. It can display headers, which can be very useful when trying to track down difficult issues with web application. It is also very useful if you ever need to do analyze something like SOAP communication.
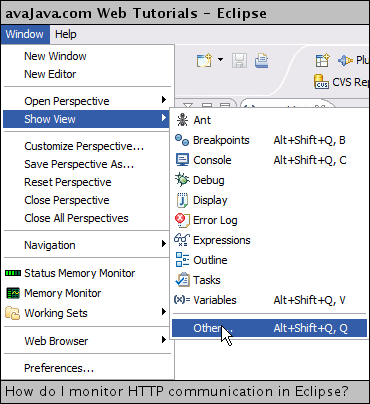
If you have the Eclipse Web Tools, you should have the TCP/IP Monitor view, which can be found at Window → Show View → Other.
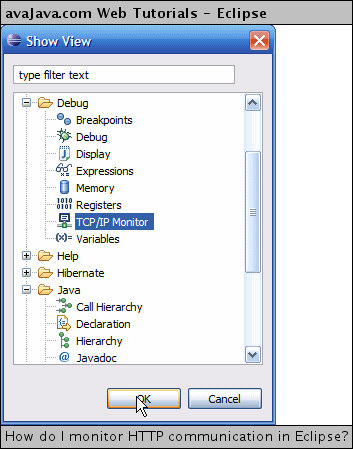
I selected the TCP/IP Monitor view and clicked OK.
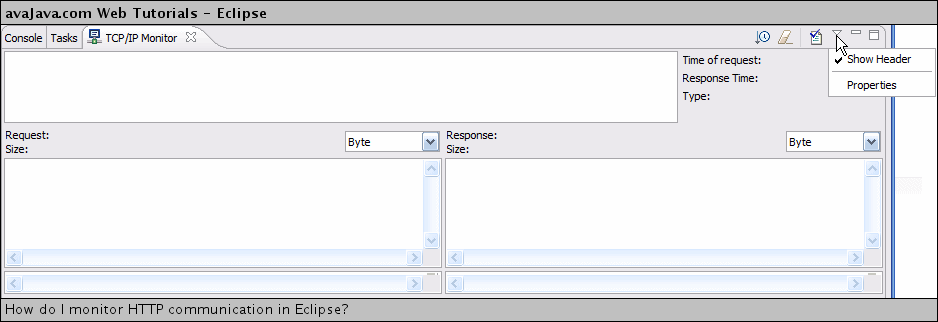
This brought up the monitor view. I checked the 'Show Header' option and then clicked 'Properties'.
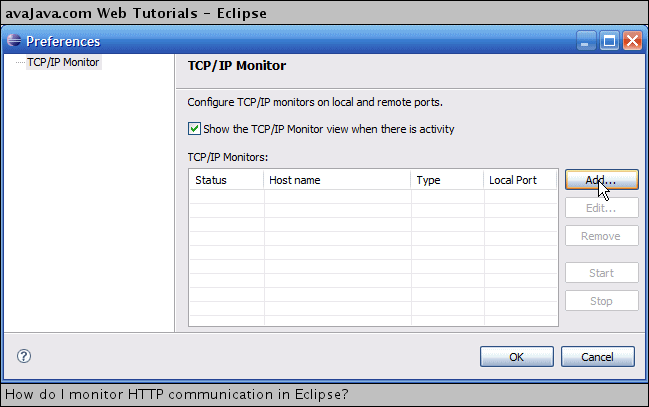
I clicked 'Add' to add a new monitor.
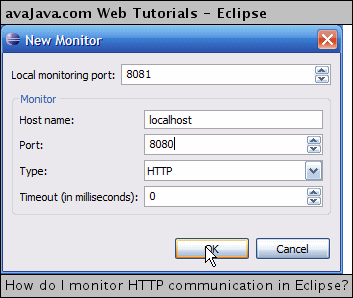
I set the monitor up to listen on port 8081 and to send requests to 8081 to localhost:8080.
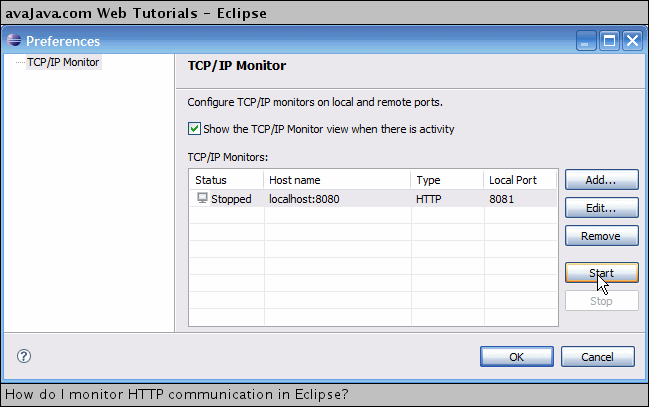
I clicked 'Start' to start the port 8081 monitor.
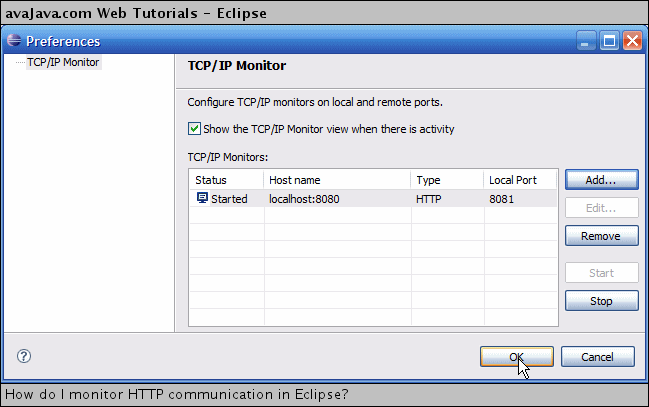
I clicked OK to return.
If we fire up our web application on the default 8080 port and we try to hit 8080 directly, we should see that the monitor is not hit, since the request went directly to 8080.

As expected, the TCP/IP Monitor shows that it wasn't hit.

Next, let's try hitting port 8081. This should hit the TCP/IP Monitor listening on port 8081, and this should get forwarded to port 8080. TomcatSW should receive the request for the web page and send back the results.

As expected, the monitor now shows the communication between the browser and the local Tomcat application. We can see in the request header that the browser asks localhost:8081 for /java-tutorials/, which returns an htmlW page which is displayed in the bottom right-hand section of the results.

We can see that a cssW file and five graphic files were requested in order to render the html page. If we click on the header.jpg file, we can see that the monitor displays the actual image! In my version of EclipseSW, sometimes the monitor has some trouble display certain images, but in this example, it worked great.

I've seen that in my version of Eclipse, the monitor can sometimes get stuck, and I need to refresh the browser in order for the request to get completed. I wouldn't recommend having the monitor running all the time, but it can be very useful for things such as watching the cookieW communication between your browser and servletW container.
- How do I monitor HTTP communication in Eclipse?
- How do I debug JavaScript in Safari?
- How do I use Cygwin in Geophysics ?
- How do I install fonts in Fedora
- How do I write things in Swift?
- How do I find a particular class from an Eclipse plug-in?
- 删除eclipse中安装的插件(How do I remove a plug-in?)
- How do I get start in QA/Test
- How do I include one DTD (or fragment) in another?
- How do I set breakpoints in modal dialogs?
- How do I create delegates in Objective-C?
- How do I change the default runlevel in Feodra 15?
- How do I disable video thumbnails in Windows 7?
- How do I register a custom filetype in iOS【链接】
- How do I get exception details in XCode 4.6?
- How do I run a 64-bit guest in VirtualBox?
- How do I convert from BLOB to TEXT in Mysql?
- How do I design an arbitrary system in an interview?
- fatal error C1010: unexpected end of file while looking for precompiled head
- vc MFC picture控件 yuv图像缩放 方法
- 几个小想法——不专心
- 【百度地图API】自行获取区域经纬度的工具
- 使用SQLWarning20.27.10.Using SQLWarning
- How do I monitor HTTP communication in Eclipse?
- char* 赋值时单引号和双引号的区别?include”“和include<>的区别
- 在Windows下使用命令提示符以及VS提供的CL编译器编译运行C/C++
- opencv 数组与数相乘函数为cvCvtScale()
- JQuery learning(6):JQuery callback function
- Python的时间:秒和字符串之间的转换
- 4. OpenGL综合知识 --- 窗口系统Windows和Linux/X
- C# 向一个DataTable内插入另一个DataTable的行,error“该行已属于另一个表”
- float与double的范围和精度


