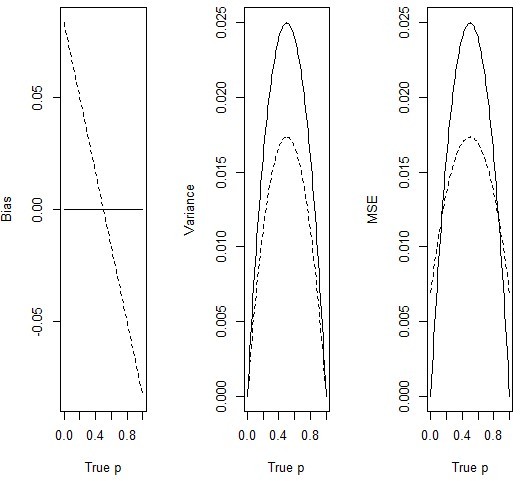
R code to the plot the bias, variance, and MSE for the beta/binomial model
来源:互联网 发布:蚁群算法两点最短路径 编辑:程序博客网 时间:2024/04/29 20:09
http://www4.stat.ncsu.edu/~reich/st740/MSEplots.R
MSEplot<-function(n,a,b,plot.type="mse"){ #This function assumes the model y~binom(n,p); p ~ beta(a,b) #and compares the bias, variances, and MSE of #d1=y/n (MLE) and d2=(y+a)/(n+a+b) p.grid<-seq(0,1,0.01) bias1<-0*p.grid bias2<-(a-(a+b)*p.grid)/(n+a+b) var1<-p.grid*(1-p.grid)/n var2<-n*p.grid*(1-p.grid)/(n+a+b)^2 mse1<-bias1^2+var1 mse2<-bias2^2+var2 if(plot.type=="bias"){ plot(p.grid,bias1,type="l",xlab="True p",ylab="Bias",ylim=range(c(bias1,bias2))) lines(p.grid,bias2,lty=2) } if(plot.type=="variance"){ plot(p.grid,var1,type="l",xlab="True p",ylab="Variance",ylim=range(c(var1,var2))) lines(p.grid,var2,lty=2) } if(plot.type=="MSE"){ plot(p.grid,mse1,type="l",xlab="True p",ylab="MSE",ylim=range(c(mse1,mse2))) lines(p.grid,mse2,lty=2) } # legend("topright",c("MLE","Post Mean"),lty=1:2,inset=0.05)}par(mfrow=c(1,3))MSEplot(n=10,a=1,b=1,plot.type="bias")MSEplot(n=10,a=1,b=1,plot.type="variance")MSEplot(n=10,a=1,b=1,plot.type="MSE")
- R code to the plot the bias, variance, and MSE for the beta/binomial model
- Understanding the Bias-Variance Tradeoff
- Understanding the Bias-Variance Tradeoff
- Understanding the Bias-Variance Tradeoff
- Using R to read and plot the csv data
- Understanding the Bias-Variance Tradeoff (理解偏差-方差权衡)
- 1175: The Binomial Function
- 机器学习方差和偏差权衡(Understanding the Bias-Variance Tradeoff)
- Bias and Variance Tradeoff
- bias and variance
- Bias and Variance
- bias and variance
- Bias and Variance
- bias and variance
- Regularization and Bias/Variance
- bias and variance
- how to config the tftpd-hpa server in the ubuntu using for remote tftp client '-p' and '-r' command
- ABAP code to find all the User Exits and BADIs for any transaction
- 个人日志20120228
- Win7下Masm for Windows2012与小红伞
- Powerdesigner 数据库设计
- CSDN社区分享面试经历活动作品8——最近的六次面试
- 程序员不应该去的三种公司
- R code to the plot the bias, variance, and MSE for the beta/binomial model
- MySQL数据表类型
- 话说 abstract 跟 interface
- Struts2的iterator标签
- Hash表的算法与应用
- android_Android应用开发之(按需设置Broadcast receiver)
- 24款非常实用的CSS3工具终极收藏
- Ubuntu文本编辑器gedit打开中文出现乱码的解决办法
- 获取本机的域名和ip