jfreechart使用柱状图重叠
来源:互联网 发布:linux xwindows编程 编辑:程序博客网 时间:2024/04/27 11:57
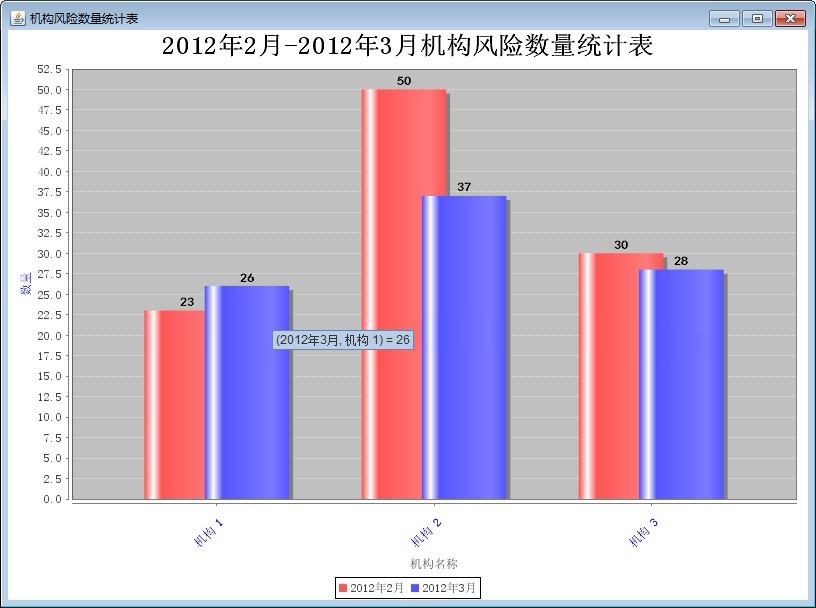
此篇主要用到重叠效果
关键代码:
CategoryPlot plot = chart.getCategoryPlot();//获得图表区域对象 //设置图表的纵轴和横轴org.jfree.chart.axis.CategoryAxis org.jfree.chart.axis.CategoryAxis domainAxis = plot.getDomainAxis(); domainAxis.setLowerMargin(0.1);//设置距离图片左端距离此时为10% domainAxis.setUpperMargin(0.1);//设置距离图片右端距离此时为百分之10 domainAxis.setCategoryLabelPositionOffset(10);//图表横轴与标签的距离(10像素) domainAxis.setCategoryMargin(0.2);//横轴标签之间的距离20% domainAxis.setMaximumCategoryLabelLines(1); domainAxis.setMaximumCategoryLabelWidthRatio(0); //设定柱子的属性// org.jfree.chart.axis.ValueAxis rangeAxis = plot.getRangeAxis();//// rangeAxis.setUpperMargin(0.1);//设置最高的一个柱与图片顶端的距离(最高柱的10%)//////// //设置图表的颜色// org.jfree.chart.renderer.category.BarRenderer renderer; renderer = new org.jfree.chart.renderer.category.BarRenderer();//// renderer.setBaseOutlinePaint(Color.red);//// renderer.setSeriesPaint(0, new Color(0, 255, 255));//计划柱子的颜色为青色//// renderer.setSeriesOutlinePaint(0,Color.BLACK);//边框为黑色//// renderer.setSeriesPaint(1, new Color(0, 255, 0));//实报柱子的颜色为绿色//// renderer.setSeriesOutlinePaint(1,Color.red);//边框为红色// renderer.setItemMargin(-0.1);//组内柱子间隔为组宽的10%//// //显示每个柱的数值,并修改该数值的字体属性// renderer.setItemLabelGenerator(new StandardCategoryItemLabelGenerator());// renderer.setItemLabelFont(new Font("黑体",Font.BOLD,12));//12号黑体加粗// renderer.setItemLabelPaint(Color.black);//字体为黑色// renderer.setItemLabelsVisible(true); NumberFormat nf= NumberFormat.getNumberInstance(); StandardCategoryToolTipGenerator generator=new StandardCategoryToolTipGenerator(StandardCategoryToolTipGenerator.DEFAULT_TOOL_TIP_FORMAT_STRING,nf); renderer.setToolTipGenerator(generator); plot.setRenderer(renderer);//使用我们设计的效果
整个代码:
/** * */package com.huaxia.bank.test;import java.awt.Color;import java.awt.Dimension;import java.awt.Font;import java.text.NumberFormat;import org.jfree.chart.ChartFactory;import org.jfree.chart.ChartPanel;import org.jfree.chart.JFreeChart;import org.jfree.chart.axis.AxisLocation;import org.jfree.chart.axis.CategoryAxis;import org.jfree.chart.axis.CategoryLabelPositions;import org.jfree.chart.axis.ValueAxis;import org.jfree.chart.labels.CategoryToolTipGenerator;import org.jfree.chart.labels.StandardCategoryItemLabelGenerator;import org.jfree.chart.labels.StandardCategoryToolTipGenerator;import org.jfree.chart.plot.CategoryPlot;import org.jfree.chart.plot.PlotOrientation;import org.jfree.chart.title.TextTitle;import org.jfree.data.category.DefaultCategoryDataset;import org.jfree.ui.ApplicationFrame;import org.jfree.ui.RefineryUtilities;/** * @author cuiran * */public class BarExample5 extends ApplicationFrame { //字体配置方法(解决中文问题) private static void configFont(JFreeChart chart) { // 配置字体 Font xfont = new Font("宋体", Font.PLAIN, 12);// X轴 Font yfont = new Font("宋体", Font.PLAIN, 12);// Y轴 Font kfont = new Font("宋体", Font.PLAIN, 12);// 底部 Font titleFont = new Font("宋体", Font.BOLD, 25); // 图片标题 CategoryPlot plot = chart.getCategoryPlot();// 图形的绘制结构对象 // 图片标题 chart.setTitle(new TextTitle(chart.getTitle().getText(), titleFont)); // 底部 chart.getLegend().setItemFont(kfont); // X 轴 CategoryAxis domainAxis = plot.getDomainAxis(); domainAxis.setLabelFont(xfont);// 轴标题 domainAxis.setTickLabelFont(xfont);// 轴数值 domainAxis.setTickLabelPaint(Color.BLUE); // 字体颜色 domainAxis.setCategoryLabelPositions(CategoryLabelPositions.UP_45); // 横轴上的label斜显示 // Y 轴 ValueAxis rangeAxis = plot.getRangeAxis(); rangeAxis.setLabelFont(yfont); rangeAxis.setLabelPaint(Color.BLUE); // 字体颜色 rangeAxis.setTickLabelFont(yfont); }public BarExample5(String title) {super(title);DefaultCategoryDataset dataset = new DefaultCategoryDataset();dataset.addValue(23.0, "2012年2月", "机构 1");dataset.addValue(50.0, "2012年2月", "机构 2");dataset.addValue(30.0, "2012年2月", "机构 3");dataset.addValue(26.0, "2012年3月", "机构 1");dataset.addValue(37.0, "2012年3月", "机构 2");dataset.addValue(28.0, "2012年3月", "机构 3");//dataset.addValue(21.0, "风险 3", "机构 1");//dataset.addValue(67.0, "风险 3", "机构 2");//dataset.addValue(18.0, "风险 3", "机构 3");JFreeChart chart = ChartFactory.createBarChart("2012年2月-2012年3月机构风险数量统计表", // chart// title"机构名称", // domain axis label"数量", // range axis labeldataset, // dataPlotOrientation.VERTICAL, // orientationtrue, // include legendtrue, // tooltips?false // URLs?);configFont(chart); CategoryPlot plot = chart.getCategoryPlot();//获得图表区域对象 //设置图表的纵轴和横轴org.jfree.chart.axis.CategoryAxis org.jfree.chart.axis.CategoryAxis domainAxis = plot.getDomainAxis(); domainAxis.setLowerMargin(0.1);//设置距离图片左端距离此时为10% domainAxis.setUpperMargin(0.1);//设置距离图片右端距离此时为百分之10 domainAxis.setCategoryLabelPositionOffset(10);//图表横轴与标签的距离(10像素) domainAxis.setCategoryMargin(0.2);//横轴标签之间的距离20% domainAxis.setMaximumCategoryLabelLines(1); domainAxis.setMaximumCategoryLabelWidthRatio(0); //设定柱子的属性// org.jfree.chart.axis.ValueAxis rangeAxis = plot.getRangeAxis();//// rangeAxis.setUpperMargin(0.1);//设置最高的一个柱与图片顶端的距离(最高柱的10%)//////// //设置图表的颜色// org.jfree.chart.renderer.category.BarRenderer renderer; renderer = new org.jfree.chart.renderer.category.BarRenderer();//// renderer.setBaseOutlinePaint(Color.red);//// renderer.setSeriesPaint(0, new Color(0, 255, 255));//计划柱子的颜色为青色//// renderer.setSeriesOutlinePaint(0,Color.BLACK);//边框为黑色//// renderer.setSeriesPaint(1, new Color(0, 255, 0));//实报柱子的颜色为绿色//// renderer.setSeriesOutlinePaint(1,Color.red);//边框为红色// renderer.setItemMargin(-0.1);//组内柱子间隔为组宽的10%//// //显示每个柱的数值,并修改该数值的字体属性// renderer.setItemLabelGenerator(new StandardCategoryItemLabelGenerator());// renderer.setItemLabelFont(new Font("黑体",Font.BOLD,12));//12号黑体加粗// renderer.setItemLabelPaint(Color.black);//字体为黑色// renderer.setItemLabelsVisible(true); NumberFormat nf= NumberFormat.getNumberInstance(); StandardCategoryToolTipGenerator generator=new StandardCategoryToolTipGenerator(StandardCategoryToolTipGenerator.DEFAULT_TOOL_TIP_FORMAT_STRING,nf); renderer.setToolTipGenerator(generator); plot.setRenderer(renderer);//使用我们设计的效果//////// //设置纵横坐标的显示位置//// plot.setDomainAxisLocation(AxisLocation.BOTTOM_OR_LEFT);//学校显示在下端(柱子竖直)或左侧(柱子水平)//// plot.setRangeAxisLocation(AxisLocation.BOTTOM_OR_LEFT); //人数显示在下端(柱子水平)或左侧(柱子竖直)ChartPanel chartPanel = new ChartPanel(chart, false);chartPanel.setPreferredSize(new Dimension(800, 570));setContentPane(chartPanel);}/** * */private static final long serialVersionUID = 1L;/** * @param args */public static void main(String[] args) {BarExample5 demo = new BarExample5("机构风险数量统计表");demo.pack();RefineryUtilities.centerFrameOnScreen(demo);demo.setVisible(true);}}
- jfreechart使用柱状图重叠
- jfreechart使用柱状图重叠
- jfreechart使用柱状图重叠
- jfreechart使用柱状图重叠
- jfreechartDemo--使用jfreechart制作柱状图
- JFreeChart -- 柱状图
- jfreechart柱状图
- JFreeChart--柱状图
- jsp中JFreeChart柱状图的详细使用
- 使用JFreeChart绘制3D柱状图
- 使用JFreeChart生成柱状图和饼图
- 使用JFreeChart实现基于Web的柱状图
- 使用JFreeChart实现基于Web的柱状图
- JFreeChart 使用一 直方图之简单柱状图
- 使用JFreeChart实现基于Web的柱状图
- 使用JFreeChart实现基于Web的柱状图
- 使用jfreechart在jsp页面柱状图统计
- Jfreechart-Jfreechart的使用(图表绘制)[柱状图]
- 深入浅出学习GIT(一)
- 使用委托
- 升级日志_20120105(重大突破!!!)
- Wp7,使你的程序在程序列表中的名称自适应手机语言设置
- Linux系统下常用性能分析工具 top命令详解
- jfreechart使用柱状图重叠
- 一场不分手的恋爱
- CGI程序学习
- Oracle OLAP 与 OLTP 介绍 .(转)
- #define中#和##的作用
- 【单元复习】之标日初级上册第一,二单元
- AG阅读总结1——数据库克隆
- 使用rabbitMQ
- php面向对象之多态