使用WINDBG检测内存泄漏
来源:互联网 发布:港澳直播软件 编辑:程序博客网 时间:2024/06/12 01:10
使用WINDBG检测内存泄漏
一、使用命令!heap –s抓取快照
二、再次使用命令抓取快照
三、使用命令查看内存情况!heap –stat –h addr【!heap -stat -h 03570000】
四、使用命令分别查看较高的内存使用情况!heap –flt s 16c
五、使用命令查看调用堆栈即可以判断内存泄漏情况!heap –p –a 0bba8530
The !heap command of Windbg is used to display heaps. !heap is well documented in the Windbg help.
I have developed a small program which leaks memory, and will demonstrate further using the same.
![]() Collapse |Copy Code
Collapse |Copy Code
int _tmain(int argc, _TCHAR* argv[]) { while(1) { AllocateMemory(); } return 0; } void AllocateMemory() { int* a = new int[2000]; ZeroMemory(a, 8000); Sleep(1); }The above program leaks an integer array of size 2000*4 bytes.
After attaching Windbg to the process, execute the !heap –s command. -s stands for summary. Below is the output of the !heap -s for the leaking process:
![]() Collapse |Copy Code
Collapse |Copy Code
0:001> !heap -s NtGlobalFlag enables following debugging aids for new heaps: validate parameters stack back traces Heap Flags Reserv Commit Virt Free List UCR Virt Lock Fast (k) (k) (k) (k) length blocks cont. heap ----------------------------------------------------------------------------- 00150000 58000062 1024 12 12 1 1 1 0 0 L 00250000 58001062 64 24 24 15 1 1 0 0 L 00260000 58008060 64 12 12 10 1 1 0 0 00330000 58001062 64576 47404 47404 13 4 1 0 0 -----------------------------------------------------------------------------Let the process execute for some time, and then re-break in to the process, and execute !heap -s again. Shown below is the output of the command:
![]() Collapse |Copy Code
Collapse |Copy Code
0:001> !heap -s NtGlobalFlag enables following debugging aids for new heaps: validate parameters stack back traces Heap Flags Reserv Commit Virt Free List UCR Virt Lock Fast (k) (k) (k) (k) length blocks cont. heap ----------------------------------------------------------------------------- 00150000 58000062 1024 12 12 1 1 1 0 0 L 00250000 58001062 64 24 24 15 1 1 0 0 L 00260000 58008060 64 12 12 10 1 1 0 0 00330000 58001062 261184 239484 239484 14 4 1 0 0 -----------------------------------------------------------------------------Lines marked in bold show the growing heap. The above snapshot shows a heap with the handle 00330000 growing.
Execute “!heap -stat –h 00330000” for the growing heap. This command shows the heap statistics for the growing heap. Shown below is the command's output.
![]() Collapse |Copy Code
Collapse |Copy Code
0:001> !heap -stat -h 00330000 heap @ 00330000 group-by: TOTSIZE max-display: 20 size #blocks total ( %) (percent of total busy bytes) 1f64 76c6 - e905f58 (99.99) 1800 1 - 1800 (0.00) 824 2 - 1048 (0.00) 238 2 - 470 (0.00) 244 1 - 244 (0.00) 4c 5 - 17c (0.00) b0 2 - 160 (0.00) 86 2 - 10c (0.00) 50 3 - f0 (0.00) 74 2 - e8 (0.00) 38 4 - e0 (0.00) 48 3 - d8 (0.00) c4 1 - c4 (0.00) 62 2 - c4 (0.00) be 1 - be (0.00) b8 1 - b8 (0.00) ae 1 - ae (0.00) ac 1 - ac (0.00) 55 2 - aa (0.00) a4 1 - a4 (0.00)The above snapshot shows 0x76c6 blocks of size 1f64 being allocated (marked in bold). Such a huge number of blocks of the same size makes us suspect that these can be leaked blocks. Rest of the block allocations do not have growing block numbers.
The next step is to get the address of these blocks. Use the command !heap -flt s 1f64. This command filters all other blocks of heap and displays the details of blocks having size 1f64.
Shown below is the output for the command:
![]() Collapse |Copy Code
Collapse |Copy Code
0:001> !heap -flt s 1f64 _HEAP @ 150000 _HEAP @ 250000 _HEAP @ 260000 _HEAP @ 330000 HEAP_ENTRY Size Prev Flags UserPtr UserSize - state 003360e0 03f0 0000 [07] 003360e8 01f64 - (busy) 00338060 03f0 03f0 [07] 00338068 01f64 - (busy) 00339fe0 03f0 03f0 [07] 00339fe8 01f64 - (busy) 0033bf60 03f0 03f0 [07] 0033bf68 01f64 - (busy) 0033dee0 03f0 03f0 [07] 0033dee8 01f64 - (busy) 01420040 03f0 03f0 [07] 01420048 01f64 - (busy) 01421fc0 03f0 03f0 [07] 01421fc8 01f64 - (busy) 01423f40 03f0 03f0 [07] 01423f48 01f64 - (busy) 01425ec0 03f0 03f0 [07] 01425ec8 01f64 - (busy) 01427e40 03f0 03f0 [07] 01427e48 01f64 - (busy) 01429dc0 03f0 03f0 [07] 01429dc8 01f64 - (busy) 0142bd40 03f0 03f0 [07] 0142bd48 01f64 - (busy) 0142dcc0 03f0 03f0 [07] 0142dcc8 01f64 - (busy) 0142fc40 03f0 03f0 [07] 0142fc48 01f64 - (busy) 01431bc0 03f0 03f0 [07] 01431bc8 01f64 - (busy) 01433b40 03f0 03f0 [07] 01433b48 01f64 - (busy) 01435ac0 03f0 03f0 [07] 01435ac8 01f64 - (busy) 01437a40 03f0 03f0 [07] 01437a48 01f64 - (busy) 014399c0 03f0 03f0 [07] 014399c8 01f64 - (busy) 0143b940 03f0 03f0 [07] 0143b948 01f64 - (busy) 0143d8c0 03f0 03f0 [07] 0143d8c8 01f64 - (busy) 0143f840 03f0 03f0 [07] 0143f848 01f64 - (busy) 014417c0 03f0 03f0 [07] 014417c8 01f64 - (busy) 01443740 03f0 03f0 [07] 01443748 01f64 - (busy) 014456c0 03f0 03f0 [07] 014456c8 01f64 - (busy) 01447640 03f0 03f0 [07] 01447648 01f64 - (busy) 014495c0 03f0 03f0 [07] 014495c8 01f64 - (busy) 0144b540 03f0 03f0 [07] 0144b548 01f64 - (busy) 0144d4c0 03f0 03f0 [07] 0144d4c8 01f64 - (busy) 0144f440 03f0 03f0 [07] 0144f448 01f64 - (busy) 014513c0 03f0 03f0 [07] 014513c8 01f64 - (busy) 01453340 03f0 03f0 [07] 01453348 01f64 - (busy) 014552c0 03f0 03f0 [07] 014552c8 01f64 - (busy) 01457240 03f0 03f0 [07] 01457248 01f64 - (busy) 014591c0 03f0 03f0 [07] 014591c8 01f64 - (busy) 0145b140 03f0 03f0 [07] 0145b148 01f64 - (busy) 0145d0c0 03f0 03f0 [07] 0145d0c8 01f64 - (busy) 0145f040 03f0 03f0 [07] 0145f048 01f64 - (busy) 01460fc0 03f0 03f0 [07] 01460fc8 01f64 - (busy) 01462f40 03f0 03f0 [07] 01462f48 01f64 - (busy) 01464ec0 03f0 03f0 [07] 01464ec8 01f64 - (busy) 01466e40 03f0 03f0 [07] 01466e48 01f64 - (busy) 01468dc0 03f0 03f0 [07] 01468dc8 01f64 - (busy)Use any UsrPtr column value from the listed output, and then use the the command !heap -p -a UsrPtr to display the call stack for
UsrPtr
. I have selected 0143d8c8 marked in bold.
Upon execution of !heap -p -a 0143d8c8, we get the call stack shown below:
![]() Collapse |Copy Code
Collapse |Copy Code
0:001> !heap -p -a 0143d8c8 address 0143d8c8 found in _HEAP @ 330000 HEAP_ENTRY Size Prev Flags UserPtr UserSize - state 0143d8c0 03f0 0000 [07] 0143d8c8 01f64 - (busy) Trace: 0025 7c96d6dc ntdll!RtlDebugAllocateHeap+0x000000e1 7c949d18 ntdll!RtlAllocateHeapSlowly+0x00000044 7c91b298 ntdll!RtlAllocateHeap+0x00000e64 102c103e MSVCR90D!_heap_alloc_base+0x0000005e 102cfd76 MSVCR90D!_heap_alloc_dbg_impl+0x000001f6 102cfb2f MSVCR90D!_nh_malloc_dbg_impl+0x0000001f 102cfadc MSVCR90D!_nh_malloc_dbg+0x0000002c 102db25b MSVCR90D!malloc+0x0000001b 102bd691 MSVCR90D!operator new+0x00000011 102bd71f MSVCR90D!operator new[]+0x0000000f 4113d8 Test2!AllocateMemory+0x00000028 41145c Test2!wmain+0x0000002c 411a08 Test2!__tmainCRTStartup+0x000001a8 41184f Test2!wmainCRTStartup+0x0000000f 7c816fd7 kernel32!BaseProcessStart+0x00000023The lines marked in bold shows the functions from our code.
Note: Sometimes, it might happen that the “!heap -s” command does not show a growing heap. In that case, use the “!heap -stat -h” command to list all the heaps with their sizes and number of blocks. Spot the growing number of blocks, and then use the “!heap –flt s SIZE” (SIZE = the size of the suspected block) command.
WinDbg的!heap命令非常强大,结合AppVerifier可以对堆(heap)内存进行详细的跟踪和分析, 我们接下来对下面的代码进行内存泄漏的分析:
//
#include "stdafx.h"
#include <Windows.h>
#include <stdio.h>
int _tmain(int argc, _TCHAR* argv[])
{
char* p1 = new char;
printf("%p\n", p1);
char* pLargeMem = new char[40000];
for(int i=0; i<1000; ++i)
{
char* p = new char[20];
}
system("pause");
return 0;
}
首先下载安装AppVerifier, 可到这里下载, 把我们需要测试的程序添加到AppVerifier的检测列表中, 然后保存。
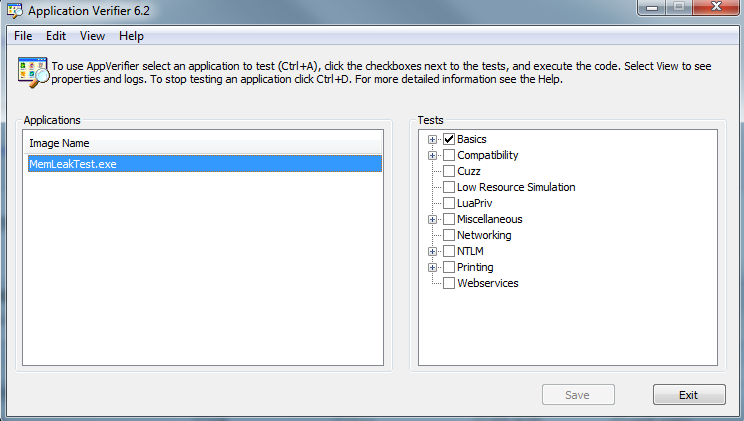
注: 我们这里用AppVerifier主要是为了打开页堆(page heap)调试功能,你也可以用系统工具 gflags.exe 来做同样的事。
双击运行我们要调试的MemLeakTest.exe, 效果如下:
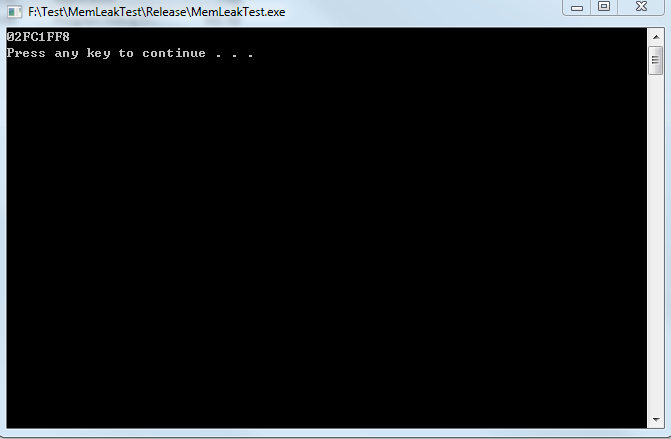
然后将WinDbg Attach上去, 输入命令 !heap -p -a 0x02FC1FF8,结果如下:
address 02fc1ff8 found in
_DPH_HEAP_ROOT @ 2f01000
in busy allocation ( DPH_HEAP_BLOCK: UserAddr UserSize - VirtAddr VirtSize)
2f02548: 2fc1ff8 1 - 2fc1000 2000
5a8c8e89 verifier!AVrfDebugPageHeapAllocate+0x00000229
77485c4e ntdll!RtlDebugAllocateHeap+0x00000030
77447e5e ntdll!RtlpAllocateHeap+0x000000c4
774134df ntdll!RtlAllocateHeap+0x0000023a
5b06a65d vrfcore!VfCoreRtlAllocateHeap+0x00000016
5a92f9ea vfbasics!AVrfpRtlAllocateHeap+0x000000e2
72893db8 MSVCR90!malloc+0x00000079
72893eb8 MSVCR90!operator new+0x0000001f
012c1008 MemLeakTest!wmain+0x00000008 [f:\test\memleaktest\memleaktest\memleaktest.cpp @ 11]
77331114 kernel32!BaseThreadInitThunk+0x0000000e
7741b429 ntdll!__RtlUserThreadStart+0x00000070
7741b3fc ntdll!_RtlUserThreadStart+0x0000001b
怎么样, 神奇吧?我们当分配该地址内存时的堆栈(stack)被完整地打印了出来。
当然有人很快会说:这是你知道内存地址的情况, 很多情况下我们是不知道该地址的,该如何分析?
对于这种情况, 我们首先需要明确一些概念, 我们new出来的内存是分配在堆上, 那一个进程里究竟有多少个堆, 每个模块都有自己单独的堆吗?实际上一个进程可以有任意多个堆,我们可以通过CreateHeap创建自己单独的堆, 然后通过HeapAlloc分配内存。 我们new出来的内存是crt(C运行库)分配的, 那就涉及到crt究竟有多少个堆了? crt有多少个堆由你编译每个模块(Dll/Exe)时的编译选项决定, 如果你运行库选项用的是/MD, 那就和其他模块共享一个堆; 如果用/MT, 那就是自己单独的堆。大部分情况下我们会用/MD,这样我们在一个模块里new内存, 另一个模块里delete不会有问题, 因为大家共享一个堆。
明确这些概念之后, 我们看看我们的测试程序有多少个堆, 输入!heap -p
Active GlobalFlag bits:
vrf - Enable application verifier
hpa - Place heap allocations at ends of pages
StackTraceDataBase @ 00160000 of size 01000000 with 00000034 traces
PageHeap enabled with options:
ENABLE_PAGE_HEAP
COLLECT_STACK_TRACES
active heaps:
+ 1160000
ENABLE_PAGE_HEAP COLLECT_STACK_TRACES
NormalHeap - 1300000
HEAP_GROWABLE
+ 1400000
ENABLE_PAGE_HEAP COLLECT_STACK_TRACES
NormalHeap - 16b0000
HEAP_GROWABLE HEAP_CLASS_1
+ 2360000
ENABLE_PAGE_HEAP COLLECT_STACK_TRACES
NormalHeap - 1280000
HEAP_GROWABLE HEAP_CLASS_1
+ 2f00000
ENABLE_PAGE_HEAP COLLECT_STACK_TRACES
NormalHeap - 31d0000
HEAP_GROWABLE HEAP_CLASS_1
接下来我们的问题就是确定哪个是我们的crt堆, 也就是我们需要分析每个堆创建时的堆栈(stack)情况.
我们接下来分析最后一个堆, handle是2f00000, 输入!heap -p -h 02f00000 分析该堆的内存分配情况
_DPH_HEAP_ROOT @ 2f01000
Freed and decommitted blocks
DPH_HEAP_BLOCK : VirtAddr VirtSize
02f01f04 : 02f09000 00002000
02f02e38 : 02f69000 00002000
037e2548 : 03892000 00002000
037e2514 : 03894000 00002000
Busy allocations
DPH_HEAP_BLOCK : UserAddr UserSize - VirtAddr VirtSize
02f01f6c : 02f05de8 00000214 - 02f05000 00002000
02f01f38 : 02f07800 00000800 - 02f07000 00002000
02f01ed0 : 02f0bde0 00000220 - 02f0b000 00002000
02f01e9c : 02f0df50 000000ac - 02f0d000 00002000
02f01e68 : 02f0ffe0 0000001f - 02f0f000 00002000
02f01e34 : 02f11fd8 00000028 - 02f11000 00002000
02f01e00 : 02f13fe0 0000001d - 02f13000 00002000
02f01dcc : 02f15fc0 0000003a - 02f15000 00002000
....
可以看到该堆 _DPH_HEAP_ROOT 结构的地址是 2f01000,通过dt命令打印该结构地址
+0x0b8 CreateStackTrace : 0x0017cbe4 _RTL_TRACE_BLOCK
可以看到StackTrace的地址是 0x0017cbe4, 通过dds命令打印该地址内的符号
0017cbe4 00178714
0017cbe8 00007001
0017cbec 000f0000
0017cbf0 5a8c8969 verifier!AVrfDebugPageHeapCreate+0x439
0017cbf4 7743a9e8 ntdll!RtlCreateHeap+0x41
0017cbf8 5a930109 vfbasics!AVrfpRtlCreateHeap+0x56
0017cbfc 755fdda2 KERNELBASE!HeapCreate+0x55
0017cc00 72893a4a MSVCR90!_heap_init+0x1b
0017cc04 72852bb4 MSVCR90!__p__tzname+0x2a
0017cc08 72852d5e MSVCR90!_CRTDLL_INIT+0x1e
0017cc0c 5a8dc66d verifier!AVrfpStandardDllEntryPointRoutine+0x99
0017cc10 5b069164 vrfcore!VfCoreStandardDllEntryPointRoutine+0x121
0017cc14 5a92689c vfbasics!AVrfpStandardDllEntryPointRoutine+0x9f
0017cc18 7741af58 ntdll!LdrpCallInitRoutine+0x14
0017cc1c 7741fd6f ntdll!LdrpRunInitializeRoutines+0x26f
0017cc20 774290c6 ntdll!LdrpInitializeProcess+0x137e
0017cc24 77428fc8 ntdll!_LdrpInitialize+0x78
0017cc28 7741b2f9 ntdll!LdrInitializeThunk+0x10
0017cc2c 00000000
0017cc30 00009001
现在我们可以看到该堆被Create时的完整堆栈了, 通过堆栈,我们可以看到该堆正是由crt创建的, 也就是说我们new的内存都分配在该堆内。
如果你觉得上面跟踪堆创建的过程太复杂,可以先忽略, 下面我们分析堆状态, 输入!heap -stat -h 0,它会分析所有堆的当前使用状态, 我们着重关注我们的crt堆02f00000:
heap @ 02f00000
group-by: TOTSIZE max-display: 20
size #blocks total ( %) (percent of total busy bytes)
9c40 1 - 9c40 (52.66)
14 3ea - 4e48 (26.38)
1000 1 - 1000 (5.39)
800 2 - 1000 (5.39)
490 1 - 490 (1.54)
248 1 - 248 (0.77)
220 1 - 220 (0.72)
214 1 - 214 (0.70)
ac 2 - 158 (0.45)
82 2 - 104 (0.34)
6a 2 - d4 (0.28)
50 2 - a0 (0.21)
28 4 - a0 (0.21)
98 1 - 98 (0.20)
94 1 - 94 (0.19)
8a 1 - 8a (0.18)
2e 3 - 8a (0.18)
41 2 - 82 (0.17)
80 1 - 80 (0.17)
7c 1 - 7c (0.16)
我们可以看到排在第一位的是大小为0x9c40 (0n40000)的内存,分配了1次, 第二位的是大小为 0x14 (0n20) 的内存,分配了3ea (0n1002)次.
回头再看我们的测试程序,怎么样? 是不是感觉很熟悉了。
输入!heap -flt s 0x9c40, 让WinDbg列出所有大小为0x9c40的内存:
_DPH_HEAP_ROOT @ 1161000
Freed and decommitted blocks
DPH_HEAP_BLOCK : VirtAddr VirtSize
Busy allocations
DPH_HEAP_BLOCK : UserAddr UserSize - VirtAddr VirtSize
_HEAP @ 1300000
_DPH_HEAP_ROOT @ 1401000
Freed and decommitted blocks
DPH_HEAP_BLOCK : VirtAddr VirtSize
Busy allocations
DPH_HEAP_BLOCK : UserAddr UserSize - VirtAddr VirtSize
_HEAP @ 16b0000
_DPH_HEAP_ROOT @ 2361000
Freed and decommitted blocks
DPH_HEAP_BLOCK : VirtAddr VirtSize
Busy allocations
DPH_HEAP_BLOCK : UserAddr UserSize - VirtAddr VirtSize
_HEAP @ 1280000
_DPH_HEAP_ROOT @ 2f01000
Freed and decommitted blocks
DPH_HEAP_BLOCK : VirtAddr VirtSize
Busy allocations
DPH_HEAP_BLOCK : UserAddr UserSize - VirtAddr VirtSize
02f024e0 : 02fc63c0 00009c40 - 02fc6000 0000b000
_HEAP @ 31d0000
可以看到, WinDbg帮我们找到了一个符合要求的分配, 它的UserAddr是02fc63c0, 该地址实际上就是代码char* pLargeMem = new char[40000]分配的地址, 按照开头的方法, 输入!heap -p -a 02fc63c0
address 02fc63c0 found in
_DPH_HEAP_ROOT @ 2f01000
in busy allocation ( DPH_HEAP_BLOCK: UserAddr UserSize - VirtAddr VirtSize)
2f024e0: 2fc63c0 9c40 - 2fc6000 b000
5a8c8e89 verifier!AVrfDebugPageHeapAllocate+0x00000229
77485c4e ntdll!RtlDebugAllocateHeap+0x00000030
77447e5e ntdll!RtlpAllocateHeap+0x000000c4
774134df ntdll!RtlAllocateHeap+0x0000023a
5b06a65d vrfcore!VfCoreRtlAllocateHeap+0x00000016
5a92f9ea vfbasics!AVrfpRtlAllocateHeap+0x000000e2
72893db8 MSVCR90!malloc+0x00000079
72893eb8 MSVCR90!operator new+0x0000001f
012c101e MemLeakTest!wmain+0x0000001e [f:\test\memleaktest\memleaktest\memleaktest.cpp @ 13]
77331114 kernel32!BaseThreadInitThunk+0x0000000e
7741b429 ntdll!__RtlUserThreadStart+0x00000070
7741b3fc ntdll!_RtlUserThreadStart+0x0000001b
可以看到该堆栈就是我们new char[40000]的堆栈, 用同样的方法, 我们可以分析出上面代码for循环中的1000次内存泄漏。
最后, 总结一下, 通过WinDbg结合AppVerifier, 我们可以详细的跟踪堆中new出来的每一块内存。 很多时候在没有源代码的Release版本中,在程序运行一段时间后,如果我们发现有大块内存或是大量同样大小的小内存一直没有释放, 我们就可以用上面的方法进行分析。有些情况下,我们甚至可以将 _CrtDumpMemoryLeaks()和WinDbg的!heap -p -a [address]命令结合起来使用, 由前者打印泄漏地址,后者分析调用堆栈,以便快速的定位问题。
使用umdh工具查内存泄露
从微软官网下载了windbg这个工具,安装,然后用里面的另一个小工具umdh工具。
就用最简单的方式来运行umdh这个工具
假设wdbg安装在D:\Program Files\Debugging Tools for Windows (x86)
运行cmd窗口,将路径设置到安装路径
1 D:\Program Files\Debugging Tools for Windows (x86)>set _NT_SYMBOL_PATH="%windir%\symbols";D:\AppPath;
2 D:\Program Files\Debugging Tools for Windows (x86)>gflags -i appname.exe +ust
启动appname.exe
3 D:\Program Files\Debugging Tools for Windows (x86)>umdh.exe -pn:appname.exe -f:FirstDump.txt
运行appname.exe中相关的各项工作任务
4 D:\Program Files\Debugging Tools for Windows (x86)>umdh.exe -pn:appname.exe -f:SecondDump.txt
5 D:\Program Files\Debugging Tools for Windows (x86)>umdh.exe FirstDump.txt SecondDump.txt -f:Result.txt
最后打开result.txt可以看到里面显示了哪里出现了内存泄露
[ umdh -p:1001 -f: 1001old.log]
exp:
set _NT_SYMBOL_PATH=D:\symbolslocal;
gflags -i ATestMemoryLeak.exe +ust
umdh -pn:ATestMemoryLeak.exe -f:1n.txt
umdh -pn:ATestMemoryLeak.exe -f:12n.txt
umdh 1n.txt 12n.txt -f:ret.txt
windbg下载:http://msdn.microsoft.com/en-us/windows/hardware/gg463016.aspx
- 使用WINDBG检测内存泄漏
- 使用WINDBG检测内存泄漏
- 使用windbg检测内存泄漏
- 如何使用windbg检测内存泄漏
- 使用BoundsChecker检测内存泄漏
- 使用BoundsChecker检测内存泄漏
- 使用BoundsChecker检测内存泄漏
- 使用MAT 检测内存泄漏
- 使用LeakCanary检测内存泄漏
- 使用GDB检测内存泄漏
- Windbg 分析内存泄漏
- Windbg 调试内存泄漏
- windbg调试内存泄漏
- Windbg 查内存泄漏
- windbg调试内存泄漏
- 使用Visual Leak Detector检测内存泄漏
- 使用Visual Leak Detector检测内存泄漏
- 使用Visual Leak Detector检测内存泄漏
- utuntu11.10下配置ssh服务
- 黑马程序员——.NET中存储过程的好处
- 伸长的守候
- hdu 4274
- 再谈C语言指针—指向另一指针的指针
- 使用WINDBG检测内存泄漏
- java技术支持 求1000之内的所有水仙花数
- 分类器中的重采样技术-bagging 和boosting
- C#--第三周实验--任务1--输入一组整数,输出所有的奇数(控制台应用)
- java技术支持 求1000之内的所有水仙花数
- 回归自然
- 字符串单词反向输出程序
- 有两个双向循环链表A,B,知道其头指针为:pHeadA,pHeadB,请写一函数将两链表中data值相同的结点删除。
- 设计模式思想单例模式