8 Command Line Tools to Monitor Linux Performance
来源:互联网 发布:校园网mac绑定错误 编辑:程序博客网 时间:2024/04/29 00:34
http://www.tecmint.com/command-line-tools-to-monitor-linux-performance/
It’s really very tough job for every System or Network administrator to monitor and debugLinux System Performance problems every day. After being a Linux Administrator for 5 years in IT industry, I came to know that how hard is to monitor and keep systems up and running. For this reason, we’ve compiled the list ofTop 8 frequently used command line monitoring tools that might be useful for everyLinux/Unix System Administrator. These commands are available under all flavors ofLinux and can be useful to monitor and find the actual causes of performance problem. This list of commands shown here are very enough for you to pick the one that is suitable for your monitoring scenario.

8 Linux Command Line Performance Monitoring Tools
1. Top – Linux Process Monitoring
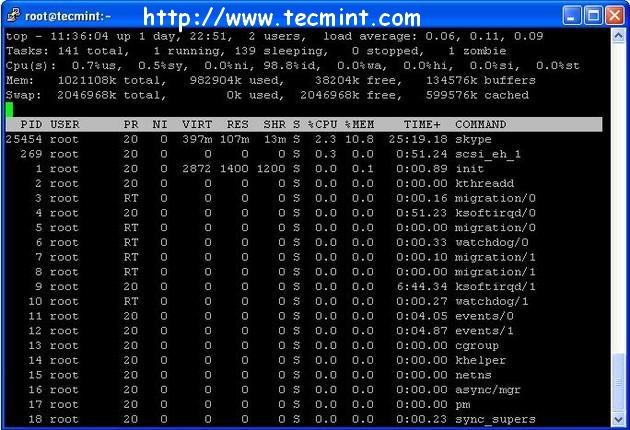
Linux Top command is a performance monitoring program which is used frequently by many system administrators to monitor Linux performance and it is available under manyLinux/Unix like operating systems. The top command used to dipslay all the running and active real-time processes in ordered list and updates it regularly. It displayCPU usage, Memory usage, Swap Memory,Cache Size, Buffer Size, Process PID,User, Commands and much more. It also shows highmemory and cpu utilization of a running processess. The top command is much userful for system administrator to monitor and take correct action when required. Let’s see top command in action.
# top

Top Command Example
For more examples of Top command read : 12 TOP Command Examples in Linux
2. VmStat – Virtual Memory Statistics
Linux VmStat command used to display statistics of virtual memory,kernerl threads, disks, system processes,I/O blocks, interrupts, CPU activity and much more. By default vmstat command is not available under Linux systems you need to install a package calledsysstat that includes a vmstat program. The common usage of command format is.
# vmstatprocs -----------memory---------- ---swap-- -----io---- --system-- -----cpu----- r b swpd free inact active si so bi bo in cs us sy id wa st 1 0 0 810420 97380 70628 0 0 115 4 89 79 1 6 90 3 0
For more Vmstat examples read : 6 Vmstat Command Examples in Linux
3. Lsof – List Open Files
Lsof command used in many Linux/Unix like system that is used to display list of all the open files and the processes. The open files included aredisk files, network sockets, pipes,devices and processes. One of the main reason for using this command is when a disk cannot be unmounted and displays the error that files are being used or opened. With this commmand you can easily identify which files are in use. The most common format for this command is.
# lsofCOMMAND PID USER FD TYPE DEVICE SIZE NODE NAMEinit 1 root cwd DIR 104,2 4096 2 /init 1 root rtd DIR 104,2 4096 2 /init 1 root txt REG 104,2 38652 17710339 /sbin/initinit 1 root mem REG 104,2 129900 196453 /lib/ld-2.5.soinit 1 root mem REG 104,2 1693812 196454 /lib/libc-2.5.soinit 1 root mem REG 104,2 20668 196479 /lib/libdl-2.5.soinit 1 root mem REG 104,2 245376 196419 /lib/libsepol.so.1init 1 root mem REG 104,2 93508 196431 /lib/libselinux.so.1init 1 root 10u FIFO 0,17 953 /dev/initctl
More lsof command usage and examples : 10 lsof Command Examples in Linux
4. Tcpdump – Network Packet Analyzer
Tcpdump one of the most widely used command-line network packet analyzer orpackets sniffer program that is used capture or filter TCP/IP packets that received or transferred on a specific interface over a network. It also provides a option to save captured packages in a file for later analysis. tcpdump is almost available in all major Linux distributions.
# tcpdump -i eth0tcpdump: verbose output suppressed, use -v or -vv for full protocol decodelistening on eth0, link-type EN10MB (Ethernet), capture size 96 bytes22:08:59.617628 IP tecmint.com.ssh > 115.113.134.3.static-mumbai.vsnl.net.in.28472: P 2532133365:2532133481(116) ack 3561562349 win 964822:09:07.653466 IP tecmint.com.ssh > 115.113.134.3.static-mumbai.vsnl.net.in.28472: P 116:232(116) ack 1 win 964822:08:59.617916 IP 115.113.134.3.static-mumbai.vsnl.net.in.28472 > tecmint.com.ssh: . ack 116 win 64347
For more tcpdump usage read : 12 Tcpdump Command Examples in Linux
5. Netstat – Network Statistics
Netstat is a command line tool for monitoring incoming andoutgoing network packets statistics as well as interface statistics. It is very useful tool for every system administrator to monitor network performance and troubleshoot network related problems.
# netstat -a | moreActive Internet connections (servers and established)Proto Recv-Q Send-Q Local Address Foreign Address Statetcp 0 0 *:mysql *:* LISTENtcp 0 0 *:sunrpc *:* LISTENtcp 0 0 *:realm-rusd *:* LISTENtcp 0 0 *:ftp *:* LISTENtcp 0 0 localhost.localdomain:ipp *:* LISTENtcp 0 0 localhost.localdomain:smtp *:* LISTENtcp 0 0 localhost.localdomain:smtp localhost.localdomain:42709 TIME_WAITtcp 0 0 localhost.localdomain:smtp localhost.localdomain:42710 TIME_WAITtcp 0 0 *:http *:* LISTENtcp 0 0 *:ssh *:* LISTENtcp 0 0 *:https *:* LISTEN
More Netstat examples : 20 Netstat Command Examples in Linux.
6. Htop – Linux Process Monitoring
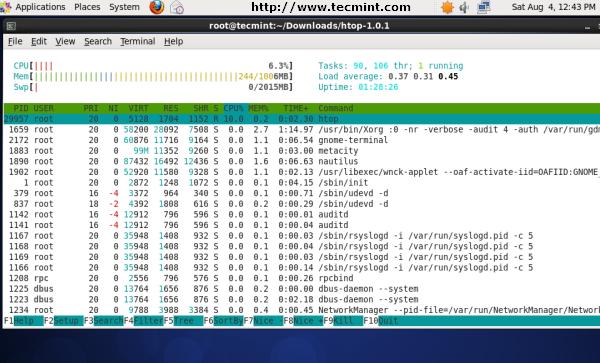
Htop is a much advanced interactive and real time Linux process monitoring tool. This is much similar to Linuxtop command but it has some rich features like user friendly interface to manage process,shortcut keys, vertical and horizontal view of the processes and much more. Htop is a third party tool and doesn’t included in Linux systems, you need to install it usingYUM package manager tool. For more information on installation read our article below.
# htop

Htop Command Example Screenshot
For Htop installation read : Install Htop (Linux Process Monitoring) in Linux
7. Iotop – Monitor Linux Disk I/O
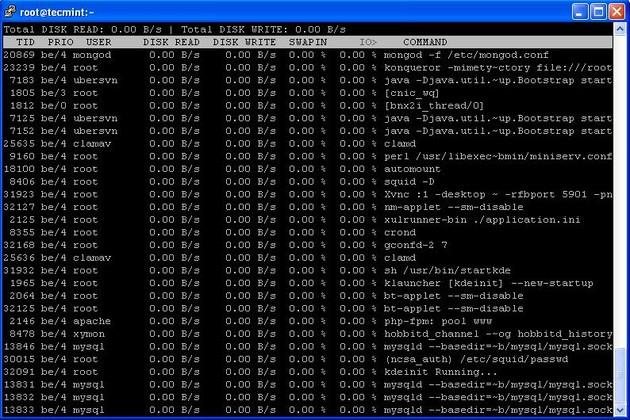
Iotop is also much similar to top command andHtop program, but it has accounting function to monitor and display real timeDisk I/O and processes. This tool is much useful for finding the exact process and high used disk read/writes of the processes.
# iotop

Iotop Command Example Screenshot
For Ioptop installation and usage read : Install Iotop in Linux
8. Iostat – Input/Output Statistics
IoStat is simple tool that will collect and show system input and output storage device statistics. This tool is often used to trace storage device performance issues includingdevices, local disks, remote disks such asNFS.
# iostatLinux 2.6.18-238.9.1.el5 (tecmint.com) 09/13/2012avg-cpu: %user %nice %system %iowait %steal %idle 2.60 3.65 1.04 4.29 0.00 88.42Device: tps Blk_read/s Blk_wrtn/s Blk_read Blk_wrtncciss/c0d0 17.79 545.80 256.52 855159769 401914750cciss/c0d0p1 0.00 0.00 0.00 5459 3518cciss/c0d0p2 16.45 533.97 245.18 836631746 384153384cciss/c0d0p3 0.63 5.58 3.97 8737650 6215544cciss/c0d0p4 0.00 0.00 0.00 8 0cciss/c0d0p5 0.63 3.79 5.03 5936778 7882528cciss/c0d0p6 0.08 2.46 2.34 3847771 3659776
For more Iostat usage and examples visit : 6 Iostat Command Examples in Linux
We would like to know what kind of monitoring programs you use tomonitor performance of your Linux servers? If we’ve missed any important tool that you would like us to include in this list, please inform us via comments and please don’t forget to share it.
- 8 Command Line Tools to Monitor Linux Performance
- 8 Command Line Tools to Monitor Linux Performance
- 15 Command Line Tools to Monitor Linux Performance
- 17 Command Line Tools to Monitor Linux Performance
- 18 Command Line Tools to Monitor Linux Performance
- 20 Command Line Tools to Monitor Linux Performance
- 20 Command Line Tools to Monitor Linux Performance
- 6 Command Line Tools for Linux Performance Monitoring
- Know How to Use Command-line Tools
- Know How to Use Command-Line Tools
- GNU/Linux Command-Line Tools Summary
- Kernel monitor and performance tools
- xcode command line tools
- 安装COmmand Line Tools
- Create Command Line Tools
- Xcode Command Line Tools
- command line tools 安装
- Command Line Tools
- xcode制作越狱后ipa安装文件
- Javascript中最常用的55个经典技巧
- 北京2008年以来全市在建在售小产权房项目分布图 (zz)
- 程序员面试题精选100题(16)-O(logn)求Fibonacci数列[算法]
- 由高粱生虫子想到的~~
- 8 Command Line Tools to Monitor Linux Performance
- Android 开发之使用Eclipse Debug调试详解
- strncpy与strncat的第三个参数,以及警告C6059
- 什么是创新
- C++程序中使用QML绑定机制
- 黑马程序员--08JAVA高级视频网络编程一些总结笔记
- 正则表达式笔记 2 边界符中的单词边界 \b
- c++运用socket获取网页源代码以及strcat与strcat_s的小差别
- C#多线程同步


