Linux驱动调试中的Debugfs的使用简介
来源:互联网 发布:淘宝用微信怎么支付 编辑:程序博客网 时间:2024/06/07 04:51
在调试linux驱动的时候,可以用debugfs来调试,debugfs类似字符设备驱动一样,甚至更简单,不需要主设备号次设备号等等,只需要实现一个file_operations,然后通过debugfs_create_file就可以在debugfs中建立一个文件结点,就像字符设备驱动那样,只需要对这个文件结点进行open就可以进行read、write、ioctl,等等操作,这些操作对应到我们在驱动里为debugfs准备的file_operations。
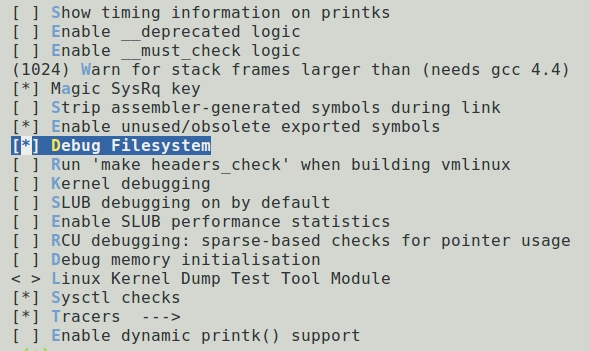
让内核支持DEBUGFS,使能宏CONFIG_DEBUG_FS,在内核配置中选中,一般是在Kernel hacking中:
在实际的使用中,举个例子来说明,在调试GPIO驱动的时候,我们可以通过debugfs来调试:
首先定义一个file_operations:
staticconst struct file_operations gpiolib_operations = {
.open = gpiolib_open,
.read = gpiolib_read,
.write = gpiolib_write,
.llseek = seq_lseek,
.release = single_release,
};
然后,建立一个debugfs文件结点:
(void)debugfs_create_file("gpio", S_IFREG | S_IRUGO,
NULL, NULL, &gpiolib_operations);
在实际的驱动中,建立debugfs文件结点一般在驱动初始化的时候。
根据我们的调试需要,实现读写操作,一般用得比较多的是read和write操作,所以在gpiolib_read和gpiolib_write里加入我们的调试代码。调用GPIO驱动的时候,我的想法是,给GPIO结点发一个读指令,那么就得传入的gpio号的状态,给GPIO结点发一个写指令,那么就根据传入的参数设置gpio的状态。于是,我只需要实现write函数:
staticssize_t gpiolib_write(struct file *file, const char __user *buf,size_t size, loff_t *ppos){charinfo[255];int port=0,value=0;memset(info,0, 255);copy_from_user(info,buf, size);printk("gpio:%s\n",info);if((info[0]>= '0') && (info[0] <= '9')){port= (info[0] - 48)*10;if((info[1]>= '0') && (info[1] <= '9')){port+= (info[1] - 48);if(info[2]== ' '){if(info[3] == 'w'){value = (info[4] =='0')?0:1;} } }}if(info[3]== 'r'){gpio_direction_input(port);printk("gpio%dstatus = %d\n", port, __gpio_get_value(port));}else if(info[3] == 'w'){printk("write%d to gpio%d\n", value, port);gpio_direction_output(port,value);__gpio_set_value(port,value); }return size;}这段代码的意思,根据传入的参数info作相应的操作,info的格式是:
info[0]和info[1]分别代表gpio号的十位和个位;
info[2]必须为空格;
info[3]为读写性质,‘w'为写,'r'为读;
info[4]如果为写,那么它表示写的状态。
这样就可以在驱动加载之后,用shell命令echo来进行调试了。
例如gpio号为57的端口控制蜂鸣器,gpio号为37的端口连接按键,那么:
蜂鸣器发声:echo 57 w1 > gpio
蜂鸣器停止:echo 57 w0 > gpio
读取按键状态:echo 37 r > gpio
那么这个gpio文件结点在哪呢?
内核启动后会把debugfs文件系统挂载到/sys/kernel/debug目录下,我们的gpio文件结点就在这里。
如果没有找到,那么可以手动挂载mount-t debugfs none /mnt,这样就挂载到/mnt目录下了。
PS:
更为强大的调试选项:
CONFIG_GPIO_SYSFS 定义此宏后 会在/sys/class/gpio/下面到处gpio的设备文件 可以通过此设备文件对gpio进行控制与读取========================================================================================================================
Linux内核里的DebugFS
2011-01-17 23:52 by wwang, 4597 阅读, 5 评论, 收藏,编辑DebugFS,顾名思义,是一种用于内核调试的虚拟文件系统,内核开发者通过debugfs和用户空间交换数据。类似的虚拟文件系统还有procfs和sysfs等,这几种虚拟文件系统都并不实际存储在硬盘上,而是Linux内核运行起来后才建立起来。
通常情况下,最常用的内核调试手段是printk。但printk并不是所有情况都好用,比如打印的数据可能过多,我们真正关心的数据在大量的输出里不是那么一目了然;或者我们在调试时可能需要修改某些内核变量,这种情况下printk就无能为力,而如果为了修改某个值重新编译内核或者驱动又过于低效,此时就需要一个临时的文件系统可以把我们需要关心的数据映射到用户空间。在过去,procfs可以实现这个目的,到了2.6时代,新引入的sysfs也同样可以实现,但不论是procfs或是sysfs,用它们来实现某些debug的需求,似乎偏离了它们创建的本意。比如procfs,其目的是反映进程的状态信息;而sysfs主要用于Linux设备模型。不论是procfs或是sysfs的接口应该保持相对稳定,因为用户态程序很可能会依赖它们。当然,如果我们只是临时借用procfs或者sysfs来作debug之用,在代码发布之前将相关调试代码删除也无不可。但如果相关的调试借口要在相当长的一段时间内存在于内核之中,就不太适合放在procfs和sysfs里了。故此,debugfs应运而生。
默认情况下,debugfs会被挂载在目录/sys/kernel/debug之下,如果您的发行版里没有自动挂载,可以用如下命令手动完成:
# mount -t debugfs none /your/debugfs/dirLinux内核为debugfs提供了非常简洁的API,本文接下来将以一个实作为例来介绍,sample code可以从这里下载。
这个实作会在debugfs中建立如下的目录结构:

其中,a对应模块中的一个u8类型的变量,b和subdir下面的c都是对应模块里的一个字符数组,只是它们的实现方式不同。
在module_init里,我们首先要建立根目录mydebug:
my_debugfs_root = debugfs_create_dir("mydebug", NULL); 第一个参数是目录的名称,第二个参数用来指定这个目录的上级目录,如果是NULL,则表示是放在debugfs的根目录里。
子目录也是用debugfs_create_dir来实现:
sub_dir = debugfs_create_dir("subdir", my_debugfs_root); 建立文件a的代码非常简单:
debugfs_create_u8("a", 0644, my_debugfs_root, &a); 这表示文件名为“a”,文件属性是0644,父目录是上面建立的“mydebug”,对应的变量是模块中的a。
Linux内核还提供了其他一些创建debugfs文件的API,请参考本文的附录。
b是一个32-bytes的字符数组,在debugfs里,数组可以用blob wrapper来实现。
char hello[32] = "Hello world!\n";structdebugfs_blob_wrapper b; b.data = (void*)hello; b.size = strlen(hello) + 1;debugfs_create_blob("b", 0644, my_debugfs_root, &b); 这里需要注意的是,blob wrapper定义的数据只能是只读的。在本例中,虽然我们把文件b的权限设定为0644,但实际这个文件还是只读的,如果试图改写这个文件,系统将提示出错。
如果需要对内核数组进行写的动作,blob wrapper就无法满足要求,我们只能通过自己定义文件操作来实现。在这个实作里,可以参考文件c的实现。c和b在模块里对应着同一块字符数组,不同的是,b是只读的,而c通过自定义的文件操作同时实现了读和写。
staticint c_open(structinode *inode, structfile *filp) { filp->private_data = inode->i_private; return0; } staticssize_t c_read(structfile *filp, char__user *buffer, size_tcount, loff_t *ppos) { if(*ppos >= 32) return0; if(*ppos + count > 32) count = 32 - *ppos; if(copy_to_user(buffer, hello + *ppos, count)) return-EFAULT; *ppos += count; returncount; } staticssize_t c_write(structfile *filp, constchar __user *buffer, size_tcount, loff_t *ppos) { if(*ppos >= 32) return0; if(*ppos + count > 32) count = 32 - *ppos; if(copy_from_user(hello + *ppos, buffer, count)) return-EFAULT; *ppos += count; returncount; } structfile_operations c_fops = { .owner = THIS_MODULE, .open = c_open, .read = c_read, .write = c_write,}; debugfs_create_file("c", 0644, sub_dir, NULL, &c_fops); 注:代码里,c_open其实并没有任何用处,因为c_read和c_write直接引用了全局变量hello。这里,我们也可以换一种写法,在read/write函数里用filp->private_data来引用字符数组hello。
到这里,三个文件和子目录已经创建完毕。在module_exit中,我们要记得释放创建的数据。
debugfs_remove_recursive(my_debugfs_root); debugfs_remove_recursive可以帮我们逐步移除每个分配的dentry,如果您想一个一个手动的移除,也可以直接调用debugfs_remove。
附录:
创建和撤销目录及文件
structdentry *debugfs_create_dir(constchar *name, structdentry *parent); structdentry *debugfs_create_file(constchar *name, mode_t mode, structdentry *parent, void*data, conststruct file_operations *fops);void debugfs_remove(struct dentry *dentry); void debugfs_remove_recursive(struct dentry *dentry); 创建单值文件
创建BLOB文件
以前都習慣用 printk 和 /proc 做輸入輸出的動作, 不過 debugfs 看起來是 User space 和 kernel space 交流更好的選擇.
先確認 Enable Kernel debugfs Function
Kernel hacking —>
-*- Debug Filesystem
先來個簡單的範例,
在你要 debug 的 modules 內, 加入 debugfs 的 include file
#include <linux/debugfs.h>
要將想要輸出的變數, 假設叫 pcie0_linked 輸出到 debugfs 上, 在 initial code 的地方加上
debugfs_create_u32("pcie0_linked", 0644, NULL, &pcie0_linked);
接下來就可以重開機了 load 新 kernel 了,
mount debugfs
$ mount -t debugfs debug /debugfs
或是寫在 /etc/fstab
debugfs /debugfs debugfs debug
這時就可以 ls /debugfs/ , 就會出現 pcie0_linked 的檔案.
$ cat /debugfs/pcie0_linked1$ echo 0 > /debugfs/pcie0_linked$ cat /debugfs/pcie0_linked0
像是 procfs 一樣, debugfs 也有 create directory 的 function, 以便讓變數可以在目錄內
我們小小改一下上面的程式, 加上 create_dir 的功能
struct dentry *pcie_dir;pcie_dir = debugfs_create_dir("pcie",NULL);if( pcie_dir != NULL ) {debugfs_create_u32("pcie0_linked", 0644, pcie_dir, &pcie0_linked);}改了以上的輸出, 接下來就可以在 /debugfs 下, 看到多了一個 pcie 的目錄, 而 pcie0_linked 就在裡面.
如果想用 hex(16 進位), 可以改用 debugfs_create_x32.
proc file system 最棒的就是可以讀寫檔案了, 可以做更多的控制.
debugfs 也有一個 function 可以讓使用者做檔案讀寫, 這邊寫一個簡單的 sample.
多 include 一個 header
#include <linux/seq_file.h>static int pcie_reg_open(struct seq_file *s, void *data){seq_printf(s, "pcie0_link status : %s\n", pcie0_linked == 1 ? "Enable": "Dreturn 0;}static int pcie_single_open(struct inode *inode, struct file *file){return single_open(file, pcie_reg_open, inode->i_private);}static ssize_t pcie_debug_write(struct file *file,const char __user *userbuf,size_t count, loff_t *ppos){char buf[20];if (copy_from_user(buf, userbuf, min(count, sizeof(buf))))return -EFAULT;printk("%s: %s \n",__FUNCTION__, buf);return count;}static const struct file_operations pcie_ios_fops = {.open = pcie_single_open,.read = seq_read,.write = pcie_debug_write,.llseek = seq_lseek,.release = single_release,};debugfs_create_file("file", 0644, pcie_dir, NULL, &pcie_ios_fops);
這樣
$ cat /debugs/pcie/file 會顯示pcie0_link status : Enable而$ echo "richliu" > /debugfs/pcie/file 會顯示pcie_debug_write: richliu$
最後要介紹的是比較特別的一種格式 blob, 這是可以傳 binary 到 user space 的格式, blob 的 struct 是
struct debugfs_blob_wrapper {void *data;unsigned long size;};
在剛剛的 Code 加上
static struct debugfs_blob_wrapper blob; –> 最好放 global.
char data[100];
sprintf(data, "Data Pointer is : %08X \n", data);
blob.data = data;
blob.size = 100;
debugfs_create_blob("blob", S_IRUSR, pcie_dir, &blob);
在 Linux 下直接用 hexdump 去讀資料出來
$ hexdump /debugfs/pcie/blob -c
0000000 D a t a P o i n t e r i s
0000010 : C 4 0 5 C 1 6 0 \n \0 \0 \0 \0
0000020 \0 \0 \0 \0 \0 \0 \0 \0 \0 \0 \0 \0 \0 \0 \0 \0
*
0000060
請記得 Blob 這個檔案是 Read Only, 只能傳出, 不能傳入…
參考:
Debugfs
Debugfs 中譯版(好像是從匪區抄過來的?)
- Linux驱动调试中的Debugfs的使用简介
- Linux驱动调试中的Debugfs的使用简介
- Linux驱动调试中的Debugfs的使用简介
- Linux驱动调试中的Debugfs的使用简介
- Linux驱动调试中的Debugfs的使用简介
- Linux驱动调试中的Debugfs的使用简介
- Linux驱动调试中的Debugfs的使用简介
- Linux驱动调试的Debugfs的使用简介
- Linux驱动调试的Debugfs的使用简介
- linux debug fs (2)----Linux驱动调试的Debugfs的使用简介
- Debugfs的使用简介
- linux中用debugfs调试
- Linux 运用debugfs调试方法
- Linux 运用debugfs调试方法
- Linux 运用debugfs调试方法
- 使用debugfs导出调试信息--一个简单的例子
- linux的debugfs
- Linux 内核调试之3 debugfs(以atheros wifi驱动分析)
- 我们都一样
- 一、ExtJS4.1安装与配置
- 文件的压缩与解压XZip,XUnzip
- POJ1008
- [SGU]106. The Equation
- Linux驱动调试中的Debugfs的使用简介
- 进程间通信的5种方式
- delphi 7开发的系统在win 7下出现的 'Invalid data type for 'UserPreferencesMask'的解决
- priority_queue的用法
- 软件工程管理——《人月神话的读书笔记》(chapter2~chapter10)
- Android 音频系统
- Debug Error! DAMAGE:after Normal Block (#Xxxx) 问题
- Log4j使用总结
- 1.请使用sun 内省api得到某一个bean的所有属性,并操作bean的其中一个属性(给属性赋值,以及得到属性的值) 。