20 debugging tips for native development with Visual Studio

来源:互联网 发布:oracle数据同步工具 编辑:程序博客网 时间:2024/05/22 05:10

真心感觉不错,特赶紧拿来分享~

转自 CodeProject:http://www.codeproject.com/Articles/469416/10-More-Visual-Studio-Debugging-Tips-for-Native-De

转自 CodeProject:http://www.codeproject.com/Articles/518159/10-Even-More-Visual-Studio-Debugging-Tips-for-Nati

10 More Visual Studio Debugging Tips for Native Development

By Marius Bancila,30 Dec 2012

 
Prize winner in Competition  "Best C++ article of October 2012"

I have recently run onto this article by Ivan Shcherbakov called 10+ powerful debugging tricks with Visual Studio. Though the article presents some rather basic tips of debugging with Visual Studio, there are others at least as helpful as those. Therefore I put together a list of ten more debugging tips for native development that work with at least Visual Studio 2008. (If you work with managed code, the debugger has even more features and there are several articles on CodeProject that present them.) Here is my list of additional tips:

  • 1. Break on Exception
  • 2. Pseudo-variables in Watch Windows
  • 3. Watch Heap Objects After Symbol Goes out of Scope
  • 4. Watch a Range of Values Inside an Array
  • 5. Avoid Stepping into Unwanted Functions
  • 6. Launch the debugger from code
  • 7. Print to Output Window
  • 8. Memory Leaks Isolation
  • 9. Debug the Release Build
  • 10. Remote Debugging

For more debugging tips check the second article in the series, 10 Even More Visual Studio Debugging Tips for Native Development.

Tip 1: Break on Exception

It is possible to instruct the debugger to break when an exception occurs, before a handler is invoked. That allows you to debug your application immediately after the exception occurs. Navigating the Call Stack should allow you to figure the root cause of the exception.

Visual Studio allows you to specify what category or particular exception you want to break on. A dialog is available from Debug > Exceptions menu. You can specify native (or managed) exceptions and aside from the default exceptions known to the debugger, you can add your custom exceptions.

Here is an example with the debugger breaking when a std::exception is thrown.

Additional readings:

  • How to: Break When an Exception is Thrown
  • How to: Add New Exceptions

Tip 2: Pseudo-variables in Watch Windows

The Watch windows or the QuickWatch dialog support some special (debugger-recognized) variables called pseudovariables. The documented one include:

  • $tid – the thread ID of the current thread
  • $pid – the process ID
  • $cmdline – the command line string that launched the program
  • $user – information for the account running the program
  • $registername – displays the content of the registerregistername

However, one that is quite useful is a pseudo-variable for the last error:

  • $err – displays the numeric code of the last error
  • $err, hr – displays the message of the last error

Additional readings:

  • Pseudovariables

Tip 3: Watch Heap Objects After Symbol Goes out of Scope

Sometimes you'd like to watch the value of an object (on the heap) even after the symbol goes of scope. When that happens, the variable in the Watch window is disabled and cannot be inspected any more (nor updated) even if the object is still alive and well.  It is possible to continue to watch it in full capability if you know the address of the object. You can then cast the address to a pointer of the object type and put that in the Watch window.

In the example bellow, _foo is no longer accessible in the Watch window after stepping out of do_foo(). However, taking its address and casting it to foo* we can still watch the object.

Tip 4: Watch a Range of Values Inside an Array

If you work with large arrays (let say at least some hundred elements, but maybe even less) expanding the array in the Watch window and looking for some particular range of elements is cumbersome, because you have to scroll a lot.  And if the array is allocated on the heap you can't even expand its elements in the Watch window.  There is a solution for that. You can use the syntax(array + <offset>), <count> to watch a particular range of <count> elements starting at the <offset> position (of course, array here is your actual object).  If you want to watch the entire array, you can simply sayarray, <count>.

If your array is on the heap, then you can expand it in the Watch window, but to watch a particular range you'd have to use a slightly different the syntax:((T*)array + <offset>), <count> (notice this syntax also works with arrays on the heap). In this case T is the type of the array's elements.

If you work with MFC and use the "array" containers from it, like CArray, CDWordArray, CStringArray, etc., you can of course apply the same filtering, except that you must watch the m_pData member of the array, which is the actual buffer holding the data.

Tip 5: Avoid Stepping into Unwanted Functions

Many times when you debug the code you probably step into functions you would like to step over, whether it's constructors, assignment operators or others. One of those that used to bother me the most was theCString constructor.  Here is an example when stepping into take_a_string() function first steps intoCString's constructor.

void take_a_string(CString const &text){}void test_string(){   take_a_string(_T("sample"));}

Luckily it is possible to tell the debugger to step over some methods, classes or entire namespaces.  The way this was implemented has changed. Back in the days of VS 6 this used to be specified through the autoexp.dat file.  Since Visual Studio 2002 this was changed to Registry settings. To enable stepping over functions you need to add some values in Registry (you can find all the detailshere):

  • The actual location depends on the version of Visual Studio you have and the platform of the OS (x86 or x64, because the Registry has to views for 64-bit Windows)
  • The value name is a number and represents the priority of the rule; the higher the number the more precedence the rules has over others.
  • The value data is a REG_SZ value representing a regular expression that specifies what to filter and what action to perform.

To skip stepping into any CString method I have added the following rule:

Having this enabled, even when you press to step into take_a_string() in the above example the debugger skips the CString's constructor.

Additional readings:

  • How to Not Step Into Functions using the Visual C++ Debugger
  • Tune the debugger using AutoExp.dat

Tip 6: Launch the debugger from code

Seldom you might need to attach with the debugger to a program, but you cannot do it with the Attach window (maybe because the break would occur too fast to catch by attaching), nor you can start the program in debugger in the first place. You can cause a break of the program and give the debugger a chance to attach by calling the __debugbreak() intrinsic.

void break_for_debugging(){   __debugbreak();}

There are actually other ways to do this, such as triggering interruption 3, but this only works with x86 platforms (ASM is no longer supported for x64 in C++).  There is also aDebugBreak() function, but this is not portable, so the intrinsic is the recommended method.

__asm int 3; 

When your program executes the intrinsic it stops, and you get a chance to attach a debugger to the process.

Additional readings:

  • __debugbreak intrinsic
  • DebugBreak and ASSERTs that work always anywhere
  • Debugging with Visual Studio 2005/2008, Part 4: Setting up Code for the Debugger

Tip 7: Print to Output Window

It is possible to show a particular text in the debugger's output window by callingDebugOutputString. If there is no debugger attached, the function does nothing.

  • OutputDebugString function
  • Mechanism of OutputDebugString

Tip 8: Memory Leaks Isolation

Memory leaks are an important problem in native development and finding them could be a serious challenging especially in large projects. Visual Studio provides reports about detected memory leaks and there are other applications (free or commercial) to help you with that. In some situations though, it is possible to use the debugger to break when an allocation that eventually leaks is done. To do this however, you must find a reproducible allocation number (which might not be that easy though). If you are able to do that, then the debugger can break the moment that is performed.

Let's consider this code that allocates 8 bytes, but never releases the allocated memory. Visual Studio displays a report of the leaked objects, and running this several times I could see it's always the same allocation number (341).

void leak_some_memory(){   char* buffer = new char[8];}Dumping objects ->d:\marius\vc++\debuggingdemos\debuggingdemos.cpp(103) : {341} normal block at 0x00F71F38, 8 bytes long. Data: <        > CD CD CD CD CD CD CD CD Object dump complete.

The steps for breaking on a particular (reproducible) allocation are:

  • Make sure you have the adequate reporting mode for memory leaks (see Finding Memory Leaks Using the CRT Library).  
  • Run the program several times until you find reproducible allocation numbers ({341} in my example above) in the memory leaks report at the end of running the program.  
  • Put a breakpoint somewhere at the start of the program so you can break as early as possible. 
  • Start the application with the debugger.  
  • When the initial breakpoint is hit, in the watch window write in the Name column:{,,msvcr90d.dll}_crtBreakAlloc, and in Value column put the allocation number that you want to investigate.  
  • Continue debugging (F5).  
  • The execution stops at the specified allocation. You can use the Call Stack to navigate back to your code where the allocation was triggered.

Following these steps for my example with allocation number 341 I was able to identify the source of the leak:

Tip 9: Debug the Release Build

Debug and Release builds are meant for different purposes. While a Debug configuration is used for development, a Release configuration, as the name implies should be used for the final version of a program. Since it's supposed that the application meets the required quality to be published, such a configuration contains optimizations and settings that break the debugging experience of a Debug build. Still, sometimes you'd like to be able to debug the Release build the same way you debug the Debug build. To do that, you need to perform some changes in the configuration.  However, in this case one could argue you no longer debug the Release build, but rather a mixture of the Debug and the Release builds.

There are several things you should do; the mandatory ones are:

  • C/C++ > General > Debug Information Format should be "Program Database (/Zi)"
  • C/C++ > Optimization > Optimization should be "Disabled (/Od)"
  • Linker > Debugging > Generate Debug Info should be "Yes (/DEBUG)"

Additional readings:

  • How to: Debug a Release Build

Tip 10: Remote Debugging

Another important debugging experience is remote debugging. This is a larger topic, covered many times, so I just want to summarize a bit.

  • You need Remote Debugging Monitor installed on the remote machine
  • The Remote Debugging Monitor must run "As Administrator" and the user must be a member of the Administrators group
  • When you run the monitor it starts a new server whose name you must use in the Visual Studio's Attach to Progress window in the Qualifier combo.   

  • The firewalls on the remote and local machine must allow communication between Visual Studio and the Remote Debugging Monitor
  • To be able to debug, the PDB files are key; in order for the Visual Studio debugger to be able to load them automatically   
    • the native PDBs must be available on the local machine (on the same path where the corresponding module is located on the remote machine),
    • the managed PDBs must be available on the remote machine.

Remote Debugging Monitor downloads:

  • Visual Studio 2008 Service Pack 1 Remote Debugger
  • Microsoft Visual Studio 2010 Remote Debugger

Additional readings:

  • Setting Up Remote Debugging
  • How to: Run the Remote Debugging Monitor
  • Loading debug symbols when remote debugging: native vs managed
  • PDB Files: What Every Developer Must Know
  • Visual Studio Remote Debugging and PDB Files
  • How to: Specify Symbol Locations and Loading Behavior

10 Even More Visual Studio Debugging Tips for Native Development

By Marius Bancila,30 Dec 2012


My previous article on debugging tips for Visual Studio was met with so much interest that determined me to share even more debugging techniques. Therefore you can find below a list of other helpful tips for debugging native applications (continuing the numbering from the previous article). These tips work with Visual Studio 2005 or newer (and at least some of them with older versions too). You can get additional information about each technique if you follow the recommended readings.

  1. Data breakpoints
  2. Renaming threads
  3. Breaking on particular threads
  4. (Roughly) Timing Execution
  5. Formatting numbers
  6. Formatting (memory) data
  7. Breaking on system DLLs
  8. Loading symbols
  9. Memory leak reports in MFC
  10. Debugging ATL

Tip 11: Data breakpoints

It is possible to instruct the debugger to break when data at a certain memory location changes. It is however only possible to create 4 such hardware data breakpoints at a time. Data breakpoints can be added only during debugging, either from the menu (Debug > New Breakpoint > New Data Breakpoint) or from the Breakpoints window.

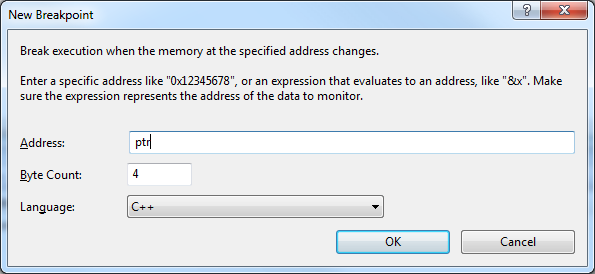
You can use either a memory address or an expression that evaluates to an address. Even though you can watch both values on the stack and on the heap, I'd say this feature is mostly helpful to find when values on the heap are changed. This can be a great help in identifying memory corruption.

In the example below, the value of a pointer is changed, instead of the value of the object it points to. To figure out where that happens I set a breakpoint on the memory where the value of the pointer is stored, i.e. &ptr (notice this must happen after the pointer is initialized). When the data changes, which means someone alters the value of the pointer, the debugger breaks and I can figure which piece of code is responsible for that.

Additional readings:

  • How Can I Find Out If My Pointers Corrupt a Memory Address?
  • How Can I Find Out Where My Pointer Is Getting Changed?

Tip 12: Renaming threads

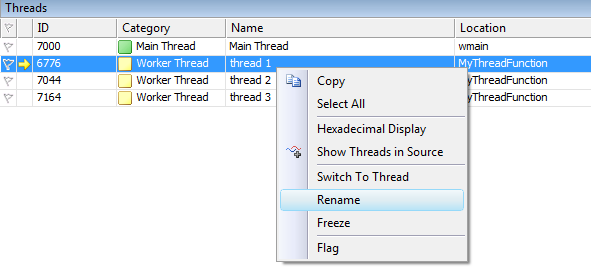
When you debug multi-threaded applications the Threads window shows you what threads are created and which one is currently running. The more threads you have the harder could be to figure out what thread exactly you are looking at (especially when the same thread procedure is run by several threads, and you don't know exactly which thread instance is currently executing).

The debugger allows you change the names of the threads. Use the context menu on a thread and rename it.

It is also possible to programmatically name a thread, though this is a little bit trickier and must be done after the thread has started, otherwise the debugger will re-initialize it with its default naming convention. Define and use the following function for renaming a thread.

typedef struct tagTHREADNAME_INFO{DWORD dwType;        // must be 0x1000LPCSTR szName;       // pointer to name (in same addr space)DWORD dwThreadID;    // thread ID (-1 caller thread)DWORD dwFlags;       // reserved for future use, most be zero} THREADNAME_INFO;void SetThreadName(DWORD dwThreadID, LPCSTR szThreadName){THREADNAME_INFO info;info.dwType = 0x1000;info.szName = szThreadName;info.dwThreadID = dwThreadID;info.dwFlags = 0;__try{RaiseException(0x406D1388, 0, sizeof(info)/sizeof(DWORD), (DWORD*)&info);}__except (EXCEPTION_CONTINUE_EXECUTION){}}

Additional readings

  • Setting a Thread Name (Unmanaged)

Tip 13: Breaking on particular threads

Another helpful technique for multi-threading applications is to filter the breakpoints to certain threads, processes or even computers. This is possible by using the Filter command on a breakpoint.

The debugger allows you to specify any combination (AND, OR, NOT) of ThreadName, ThreadId, ProcessName, ProcessId and MachineName. Knowing how to set a thread name already can make this filtering even simpler.

Additional readings:

  • How to: Specify a Breakpoint Filter
  • Setting a Breakpoint Filter

Tip 14: (Roughly) Timing Execution

In my previous article I wrote about pseudo-variables in the Watch window. One not mentioned then is@clk, which shows the value of a counter and can help getting a rough idea of how much time the code between two breakpoints took to execute. The value is expressed in microseconds. However, this is by no means a method to profile execution. You should use the Visual Studio profiler and/or performance timers for that.

It is possible to reset the clock by adding @clk=0 in the Watch window or executing that in the Immediate window. Therefore to figure how much time some piece of code took to execute do the following:

  • Set a breakpoint at the beginning of the block
  • Set a breakpoint at the end of the block
  • Add @clk in the Watch window
  • When the first breakpoint is hit type @clk=0 in the Intermediate window.
  • Run the program until the breakpoint at the end of the block is hit and check the value of @clk in the Watch window.

Notice there are tips on the web that instruct you to add two expressions in the Watch window: @clk followed by a @clk=0, which would allegedly reset the clock each time a breakpoint is hit. This used to worked in older versions of Visual Studio, but no longer works (for sure in VS2005 and newer).

Additional readings:

  • Debugging Tips - @CLK

Tip 15: Formatting numbers

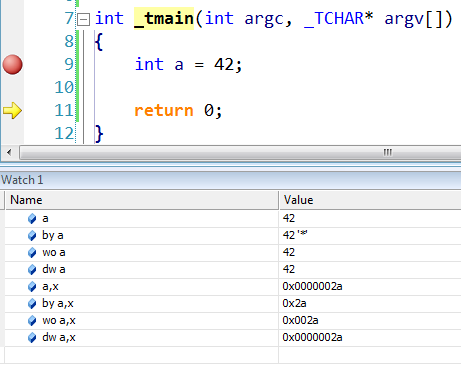
When you watch variables in the Watch or Quick Watch window, the values are displayed using the default pre-defined visualizers. When it comes to numbers, these are displayed according to their types (integer, float, double) and using the decimal base. But you can force the debugger to show the numbers as a different type, or with a different numeric base, or both.

To change the displayed type prefix the variable with:

  • by for unsigned char (aka unsigned byte)
  • wo for unsigned short (aka unsigned word)
  • dw for unsigned long (aka unsigned double word)

To change the displayed base suffix the variable name with:

  • , d or , i for signed decimal
  • , u for unsigned decimal
  • , o for unsigned octal
  • , x for lowercase hex or , X for uppercase hex

Additional readings:

  • C++ Debugger Tips

Tip 16: Formatting (memory) data

Apart from numbers, the debugger can also show formatted memory values, up to 64 bytes, in the Watch window. You can use one of the following specifiers after an expression (variable or memory address) to format the data:

  • mb or m - 16 bytes in hex followed by 16 ASCII characters
  • mw - 8 words
  • md - 4 double words
  • mq - 2 quad-words
  • ma - 64 ASCII characters
  • mu - 2-byte UNICODE characters

Additional readings:

  • Format Specifiers in C++
  • Debugging Tips in Developer Studio

Tip 17: Breaking on system DLLs

Sometimes it's useful to break when some function in a DLL, like a system DLL (think kernel32.dll or user32.dll) is called. To do this one must use the context operator provided by the native debugger. You can qualify a breakpoint location, variable name or expression:

  • {[function],[source],[module] } location
  • {[function],[source],[module] } variable_name
  • {[function],[source],[module] } expression

The braces can contain any combination of function name, source and module, but the commas must not be omitted.

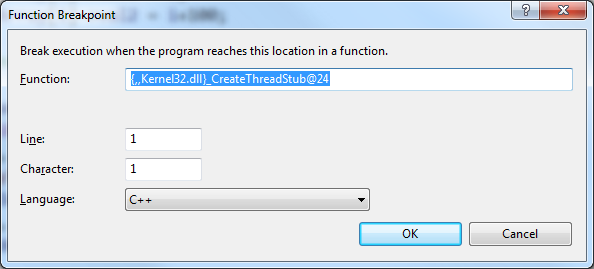
Let's say we want to break when CreateThread is called. This function is exported from kernel32.dll, and therefore the context operator should look like this:{,,kernel32.dll}CreateThread. However, this does not work as the operator requires the decorated name of CreateThread. One could useDBH.exe to figure out what the decorated name for a specific function is.

Here is how you can figure the decorated name for CreateThread:

C:\Program Files (x86)\Debugging Tools for Windows (x86)>dbh.exe -s:srv*C:\Symbols*http://msdl.microsoft.com/Download/Symbols -d C:\Windows\SysWOW64\kernel32.dll enum *CreateThread*Symbol Search Path: srv*C:\Symbols*http://msdl.microsoft.com/Download/Symbols index            address     name     1            10b4f65 :   _BaseCreateThreadPoolThread@12     2            102e6b7 :   _CreateThreadpoolWork@12     3            103234c :   _CreateThreadpoolStub@4     4            1011ea8 :   _CreateThreadStub@24     5            1019d40 :   _NtWow64CsrBasepCreateThread@12     6            1019464 :   ??_C@_0BC@PKLIFPAJ@SHCreateThreadRef?$AA@     7            107309c :   ??_C@_0BD@CIEDBPNA@TF_CreateThreadMgr?$AA@     8            102ce87 :   _CreateThreadpoolCleanupGroupStub@0     9            1038fe3 :   _CreateThreadpoolIoStub@16     a            102e6f0 :   _CreateThreadpoolTimer@12     b            102e759 :   _CreateThreadpoolWaitStub@12     c            102ce8e :   _CreateThreadpoolCleanupGroup@0     d            102e6e3 :   _CreateThreadpoolTimerStub@12     e            1038ff0 :   _CreateThreadpoolIo@16     f            102e766 :   _CreateThreadpoolWait@12    10            102e6aa :   _CreateThreadpoolWorkStub@12    11            1032359 :   _CreateThreadpool@4

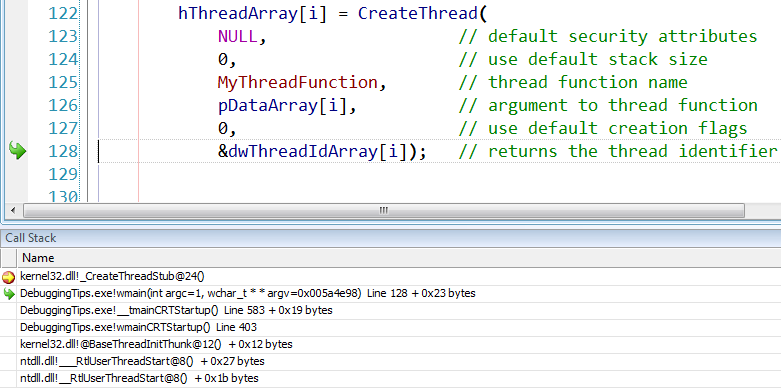
Looks like the actual name is _CreateThreadStub@24. So we should create a breakpoint at{,,kernel32.dll}_CreateThreadStub@24.

Run the program and when it breaks, ignore the message that there is no source code associated with the breakpoint.

Use the Call Stack window to navigate to your code that made the call to the function.

Additional readings:

  • How to set breakpoints without source code in Visual Studio 2010
  • Context Operator (C/C++ Language Expressions)
  • How to: Set a Function Breakpoint

Tip 18: Loading symbols

When you debug your application the Call Stack window might not display a full call stack, but skip information about system DLLs (such as kernel32.dll and user32.dll).

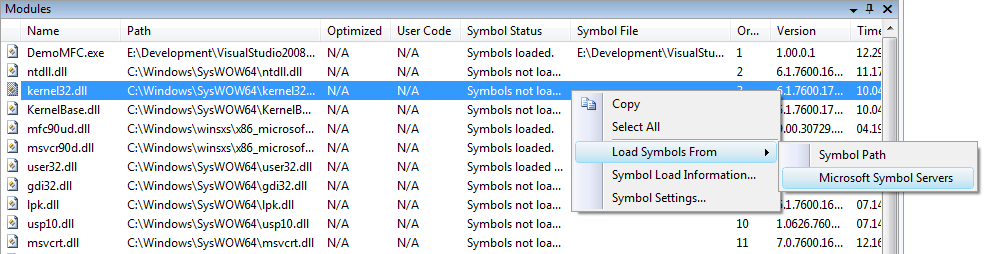
It is possible to get the full stack by loading the symbols for these DLLs. This can be done directly from the Call Stack window, using the context menu. You can either download from the pre-specified symbol path, or from Microsoft's symbols server (if it's a system DLL). After the symbols are downloaded and loaded into the debugger, the Call Stack updates.

The symbols can also be loaded from the Modules window.

Once downloaded, the symbols are stored in a cache that can be configured from Tools > Options > Debugging > Symbols.

Tip 19: Memory leak reports in MFC

If you want to get memory leak reports in MFC application you can re-defined the new operator with a DEBUG_NEW macro, which is a modified version of the new operator that keeps track of the filename and line number for each object that it allocates. In a release build DEBUG_NEW resolves to operator new.

The wizard generated MFC source files contain the following pre-processor directives after the #includes:

#ifdef _DEBUG#define new DEBUG_NEW#endif

This is how you can re-define the new operator.

However, many STL headers are incompatible with this version of operator new. If you include <map>, <vector>, <list>, <string> and others after you re-define operator new you get errors like this (shown for <vector>):

1>c:\program files (x86)\microsoft visual studio 9.0\vc\include\xmemory(43) : error C2665: 'operator new' : none of the 5 overloads could convert all the argument types1>        c:\program files\microsoft visual studio 9.0\vc\include\new.h(85): could be 'void *operator new(size_t,const std::nothrow_t &) throw()'1>        c:\program files\microsoft visual studio 9.0\vc\include\new.h(93): or       'void *operator new(size_t,void *)'1>        while trying to match the argument list '(const char [70], int)'1>        c:\program files (x86)\microsoft visual studio 9.0\vc\include\xmemory(145) : see reference to function template instantiation '_Ty *std::_Allocate<char>(size_t,_Ty *)' being compiled1>        with1>        [1>            _Ty=char1>        ]1>        c:\program files (x86)\microsoft visual studio 9.0\vc\include\xmemory(144) : while compiling class template member function 'char *std::allocator<_Ty>::allocate(std::allocator<_Ty>::size_type)'1>        with1>        [1>            _Ty=char1>        ]1>        c:\program files (x86)\microsoft visual studio 9.0\vc\include\xstring(2216) : see reference to class template instantiation 'std::allocator<_Ty>' being compiled1>        with1>        [1>            _Ty=char1>        ]

The solution is to always include these STL headers before redefining new with DEBUG_NEW.

Additional readings:

  • DEBUG_NEW

Tip 20: Debugging ATL

When you develop ATL COM components you can get some help from the debugger to watch calls for QueryInterface, AddRef and Release on your COM objects. This support is not enabled by default, but you can specify two macros to the preprocessor definitions or the pre-compiled header file. When those macros are defined information about these calls is displayed in the Output window.

These two macros are:

  • _ATL_DEBUG_QI displays the name of each interfaces that is queried for on your objects. It must be defined before atlcom.h is included.
  • _ATL_DEBUG_INTERFACES displays current reference count for the interface together with the class name and interface name, every time AddRef or Release is called. It must be defined before atlbase.h is included.

Additional readings:

  • Debugging Tips
  • ATL Debugging Techniques
  • How does _ATL_DEBUG_INTERFACES work?


原创粉丝点击