UI -- CorePloty应用指南
来源:互联网 发布:vm虚拟机下载 for mac 编辑:程序博客网 时间:2024/06/08 11:34
core-plot是一种OS X和iOS的绘图库,它与 Apple technologies like Core Animation, Core Data, and Cocoa Bindings紧密集成,提供2D的可视化数据图。下文将简要介绍在iOS开发中如何使用core-plot。
一、配置
1、从http://code.google.com/p/core-plot/下载最新版本,其中的readme有安装步骤。
2、拷贝CorePlot_1.0/Binaries/iOS文件夹中的CorePlotHeaders和libCorePlot-CocoaTouch.a到项目中
3、在项目的target build settings找到“Other Linker Flags”,添加”-ObjC“
(如果Xcode版本低于4.2,还要添加“-all_load”)
4、项目中添加QuartzCore.framework
完成配置,如下图

二、使用
在需要绘制图形的.h文件中,加上:#import"CorePlot-CocoaTouch.h"即可使用。另外需要实现CPTPlotDataSource和对应图形的代理(如曲线CPTScatterPlotDelegate和CPTScatterPlotDataSource)。
在需要绘制图形的.m文件中,
1、绘制数据图形需要一块画板CPTGraphHostingView和画布CPTXYGraph,定义并使用画板和画布如下:


2、设置画布相关属性和坐标系


3、定义图形并设置其样式——以曲线CPTScatterPlot为例

4、在画布中加上曲线

5、实现CPTPlotDataSource,为曲线添加数据。简单地需要实现以下两个函数
-(NSUInteger)numberOfRecordsForPlot:(CPTPlot *)plot ; //返回曲线的数据点个数
-(NSNumber *)numberForPlot:(CPTPlot *)plot field:(NSUInteger)fieldEnum recordIndex:(NSUInteger)index ; //返回具体点坐标值

6、到第5步已经可以将图形画出来了。另外还有一些其他用于完善图形的代理函数。如
在曲线上方添加y值:-(CPTLayer *)dataLabelForPlot:(CPTPlot *)plot recordIndex:(NSUInteger)index //CPTPlotDataSource
在曲线上标注坐标点:-(CPTPlotSymbol *)symbolForScatterPlot:(CPTScatterPlot *)plot recordIndex:(NSUInteger)index //CPTScatterPlotDataSource
点击各个数据点响应操作:-(void)scatterPlot:(CPTScatterPlot *)plot plotSymbolWasSelectedAtRecordIndex:(NSUInteger)index //CPTScatterPlotDelegate
 转载或引用请标明出处哦 ~~~~~
在《core-plot——简单使用》中,介绍了如何配置和使用core-plot,建立画布和坐标系,并绘制曲线图,在这里简单地介绍一下柱状图和饼图的绘制。
一、柱状图
1、建立并设置画板CPTGraphHostingView、画布CPTXYGraph、轴空间CPTXYPlotSpace、坐标轴集CPTXYAxisSet,具体参考《core-plot——简单使用》的代码。
2、定义柱状图并设置其具体样式

3、添加柱状图到画布上

4、实现CPTPlotDataSource,为柱状图添加数据,简单地需要实现以下两个函数:
-(NSUInteger)numberOfRecordsForPlot:(CPTPlot *)plot ; //返回柱状图的数据点个数
-(NSNumber *)numberForPlot:(CPTPlot *)plot field:(NSUInteger)fieldEnum recordIndex:(NSUInteger)index ; //返回具体点坐标值

5、到第4步柱状图已经花出来了,以下还有一些完善图形的函数
在柱子上方添加y值:-(CPTLayer *)dataLabelForPlot:(CPTPlot *)plot recordIndex:(NSUInteger)index //CPTPlotDataSource
设置某个柱子的样式(fill 或line): //CPTBarPlotDataSource
-(CPTFill *)barFillForBarPlot:(CPTBarPlot *)barPlot recordIndex:(NSUInteger)index
-(CPTLineStyle *)barLineStyleForBarPlot:(CPTBarPlot *)barPlot recordIndex:(NSUInteger)index
点击某个柱子响应操作:-(void)barPlot:(CPTBarPlot *)plot barWasSelectedAtRecordIndex:(NSUInteger)index //CPTBarPlotDelegate二、饼图
1、建立并设置画板CPTGraphHostingView、画布CPTXYGraph,具体参考《core-plot——简单使用》的代码。
2、由于饼图没有坐标轴,因此需要将画布的坐标轴集设置为nil:


-(NSUInteger)numberOfRecordsForPlot:(CPTPlot *)plot ; //返回饼图的数据点个数
//返回具体每块扇形的值,系统将自动合计并划分扇形;可以全为0,此时不会绘制饼图
-(NSNumber *)numberForPlot:(CPTPlot *)plot field:(NSUInteger)fieldEnum recordIndex:(NSUInteger)index

在扇形上方添加y值:-(CPTLayer *)dataLabelForPlot:(CPTPlot *)plot recordIndex:(NSUInteger)index //CPTPlotDataSource
设置某个扇形的颜色:-(CPTFill *)sliceFillForPieChart:(CPTPieChart *)pieChart recordIndex:(NSUInteger)index //CPTPieChartDataSource
点击某个扇形响应操作:-(void)pieChart:(CPTPieChart *)plot sliceWasSelectedAtRecordIndex:(NSUInteger)index //CPTPieChartDelegate
各种图形的绘制过程和原理相似,可以多查看CorePlotHeaders文件夹的文件。
关于core-plot的类库介绍:
https://sharmanavnidhi-navnidhi.googlecode.com/hg-history/534191a0e4881407994489291ba0df14e616fcbc/documentation/html/iOS/index.html
第四篇:同时显示两个试图,自定义坐标轴
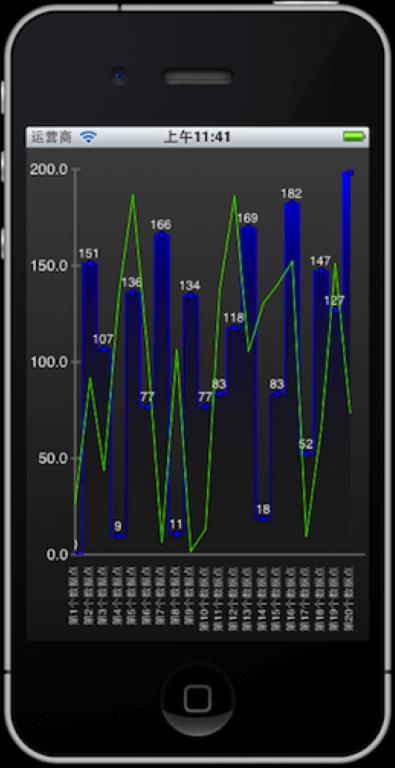
如何使用Core Plot绘制直方图和折线图
Core Plot提供了散点图(CPScatterPlot)绘制,包括折线图和直方图,如下图所示:
- UI -- CorePloty应用指南
- MID应用程序设计标准样式指南:UI组件
- MID应用程序设计标准样式指南:UI组件
- UI通用界面设计指南
- Android UI 设计指南
- UI编码指南
- org.eclipse.ui.console指南
- 转个装xine-ui的指南
- org.eclipse.ui.console指南
- org.eclipse.ui.console指南
- 移动客户端UI设计指南
- 移动客户端UI设计指南
- 移动客户端UI设计指南
- Chico UI操作指南-1
- UI应用组件调研
- UI框架和应用
- Web 应用的 UI
- Android应用UI架构
- 装载问题
- 设计模式系列之二_责任链模式(Chain of Responsibility)
- C++编程思想读书笔记之 第三章 隐藏实现
- httpclient4.2.2的几个常用方法,登录之后访问页面问题,下载文件
- 一些C语法回顾
- UI -- CorePloty应用指南
- 关于qt的一些小东东
- oracle创建表空间
- SVN commit:remains in tree-conflict错误的解决办法
- float, int , int64计算性能
- VS2008添加GIF资源
- 给phonegap添加一个支持跳转的插件
- Excel has detected that '...xls' is a SYLK file, but can not load it
- mosquitto-MQTT协议的开源实现