Web图表开发-用ChartDirector画极线图
来源:互联网 发布:linux 线程同步机制 编辑:程序博客网 时间:2024/05/22 08:09
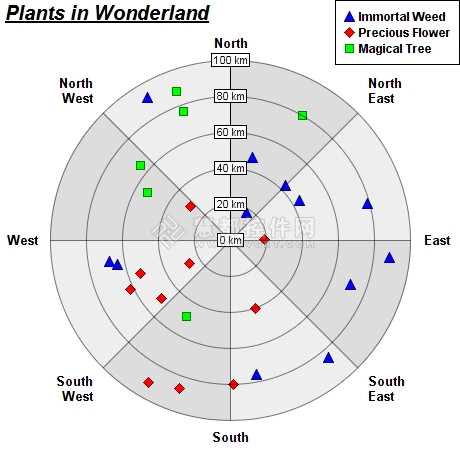
在这个例子中讲述了如何在ChartDirector中创建极地散点图,同时还演示了如何沿着角度的方向交替使用背景颜色。
这样的极地散点图可以使用创建极线图加数据符号来绘制,线条的宽度设置为0,这样擦可以只看见数据符号,出现散点图的效果。ChartDirector下载
详细的步骤如下:
- 使用PolarChart.addLineLayer创建一个极线图
- 使用PolarLayer.setDataSymbol启动数据符号
- 使用PolarLayer.setLineWidth设置线条的宽度为0
在这个例子中,值得注意的是这个图表的背景色是沿着角度的方向使用了两种交互的颜色而这个效果呢就是使用PolarChart.setPlotAreaBg实现的。
具体的代码如下:
1
2
3
4
5
6
7
8
9
10
11
12
13
14
15
16
17
18
19
20
21
22
23
24
25
26
27
28
29
30
31
32
33
34
35
36
37
38
39
40
41
42
43
44
45
46
47
48
49
50
51
52
53
54
55
56
57
58
59
60
61
62
63
64
65
66
67
68
69
70
71
72
73
74
75
76
77
78
79
80
81
82
83
84
85
86
87
88
89
90
91
92
93
94
95
96
97
98
99
100
101
// ChartDirector for ColdFusion API Access Pointcd = CreateObject("java","ChartDirector.CFChart");// A utility to allow us to create arrays with data in one line of codefunction Array() { var result = ArrayNew(1); var i =0; for(i = 1; i LTE ArrayLen(arguments); i = i +1) result[i] = arguments[i]; returnresult;}// The data for the chartdata0 = Array(43,89, 76,64, 48,18, 92,68, 44,79, 71,85);angles0 = Array(45,96, 169,258, 15,30, 330,260, 60,75, 110,140);data1 = Array(50,91, 26,29, 80,53, 62,87, 19,40);angles1 = Array(230,210, 240,310, 179,250, 244,199, 89,160);data2 = Array(88,65, 76,49, 80,53);angles2 = Array(340,310, 340,210, 30,300);// The labels on the angular axis (spokes)labels = Array("North","North<*br*>East","East", "South<*br*>East","South", "South<*br*>West","West", "North<*br*>West");// Create a PolarChart object of size 460 x 460 pixelsc = cd.PolarChart(460,460);// Add a title to the chart at the top left corner using 15pts Arial Bold Italic fontc.addTitle2(cd.TopLeft,"<*underline=2*>Plants in Wonderland","Arial Bold Italic", 15);// Set center of plot area at (230, 240) with radius 180 pixelsc.setPlotArea(230,240, 180);// Use alternative light grey/dark grey sector background colorc.setPlotAreaBg("0xdddddd","0xeeeeee", False);// Set the grid style to circular gridc.setGridStyle(False);// Add a legend box at the top right corner of the chart using 9 pts Arial Bold fontc.addLegend(459,0, True, "Arial Bold",9).setAlignment(cd.TopRight);// Set angular axis as 0 - 360, either 8 spokesc.angularAxis().setLinearScale2(0,360, labels);// Set the radial axis label formatc.radialAxis().setLabelFormat("{value} km");// Add a blue (0xff) polar line layer to the chart using (data0, angle0)layer0 = c.addLineLayer(data0,"0x0000ff", "Immortal Weed");layer0.setAngles(angles0);layer0.setLineWidth(0);layer0.setDataSymbol(cd.TriangleSymbol,11);// Add a red (0xff0000) polar line layer to the chart using (data1, angles1)layer1 = c.addLineLayer(data1,"0xff0000", "Precious Flower");layer1.setAngles(angles1);// Disable the line by setting its width to 0, so only the symbols are visiblelayer1.setLineWidth(0);// Use a 11 pixel diamond data point symbollayer1.setDataSymbol(cd.DiamondSymbol,11);// Add a green (0x00ff00) polar line layer to the chart using (data2, angles2)layer2 = c.addLineLayer(data2,"0x00ff00", "Magical Tree");layer2.setAngles(angles2);// Disable the line by setting its width to 0, so only the symbols are visiblelayer2.setLineWidth(0);// Use a 9 pixel square data point symbollayer2.setDataSymbol(cd.SquareSymbol,9);// Output the chartchart1URL = c.makeSession(GetPageContext(),"chart1");// Include tool tip for the chartimageMap1 = c.getHTMLImageMap("","", "title='{dataSetName} at ({value} km, {angle} deg)'");</cfscript><html><body style="margin:5px 0px 0px 5px"><div style="font-size:18pt; font-family:verdana; font-weight:bold"> Polar Scatter Chart</div><hr style="border:solid 1px #000080"/><cfoutput><div style="font-size:9pt; font-family:verdana; margin-bottom:1.5em"> <a href='viewsource.cfm?file=#CGI.SCRIPT_NAME#'>View Source Code</a></div><img src="getchart.cfm?#chart1URL#"usemap="##map1" border="0" /><map name="map1">#imageMap1#</map></cfoutput></body></html>下面再来看看如何在ChartDirector创建完整的带数据符号和数据标签的极线图表,如下所示:
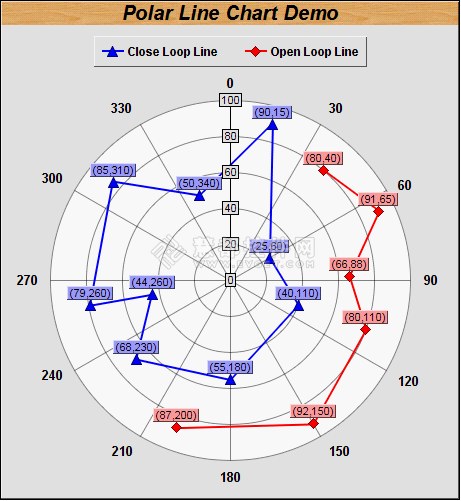
对于实现以上的这个图表,主要采用以下的步骤完成:
实现的代码如下:
1
2
3
4
5
6
7
8
9
10
11
12
13
14
15
16
17
18
19
20
21
22
23
24
25
26
27
28
29
30
31
32
33
34
35
36
37
38
39
40
41
42
43
44
45
46
47
48
49
50
51
52
53
54
55
56
57
58
59
60
61
62
63
64
65
66
67
68
69
70
71
72
73
74
75
76
77
78
79
80
81
82
83
84
85
86
87
88
89
90
91
92
93
94
95
96
97
98
99
100
101
102
103
104
105
106
107
108
cfscript>// ChartDirector for ColdFusion API Access Pointcd = CreateObject("java","ChartDirector.CFChart");// A utility to allow us to create arrays with data in one line of codefunction Array() { var result = ArrayNew(1); var i =0; for(i = 1; i LTE ArrayLen(arguments); i = i +1) result[i] = arguments[i]; returnresult;}// The data for the chartdata0 = Array(90,25, 40,55, 68,44, 79,85, 50);angles0 = Array(15,60, 110,180, 230,260, 260,310, 340);data1 = Array(80,91, 66,80, 92,87);angles1 = Array(40,65, 88,110, 150,200);// Create a PolarChart object of size 460 x 500 pixels, with a grey (e0e0e0)// background and 1 pixel 3D borderc = cd.PolarChart(460,500, "0xe0e0e0","0x000000", 1);// Set search path to current directory for loading icon imagesc.setSearchPath(GetPageContext());// Add a title to the chart at the top left corner using 15pts Arial Bold Italic// font. Use a wood pattern as the title background.c.addTitle("Polar Line Chart Demo","Arial Bold Italic",15).setBackground( c.patternColor("wood.png"));// Set center of plot area at (230, 280) with radius 180 pixels, and white (ffffff)// background.c.setPlotArea(230,280, 180,"0xffffff");// Set the grid style to circular grid, with grids below the chart layersc.setGridStyle(False, False);// Add a legend box at top-center of plot area (230, 35) using horizontal layout. Use// 10 pts Arial Bold font, with 1 pixel 3D border effect.b = c.addLegend(230,35, False, "Arial Bold", 9);b.setAlignment(cd.TopCenter);b.setBackground(cd.Transparent, cd.Transparent,1);// Set angular axis as 0 - 360, with a spoke every 30 unitsc.angularAxis().setLinearScale(0,360, 30);// Add a blue (0xff) line layer to the chart using (data0, angle0)layer0 = c.addLineLayer(data0,"0x0000ff", "Close Loop Line");layer0.setAngles(angles0);// Set the line width to 2 pixelslayer0.setLineWidth(2);// Use 11 pixel triangle symbols for the data pointslayer0.setDataSymbol(cd.TriangleSymbol,11);// Enable data label and set its formatlayer0.setDataLabelFormat("({value},{angle})");// Set the data label text box with light blue (0x9999ff) backgruond color and 1// pixel 3D border effectlayer0.setDataLabelStyle().setBackground("0x9999ff", cd.Transparent,1);// Add a red (0xff0000) line layer to the chart using (data1, angle1)layer1 = c.addLineLayer(data1,"0xff0000", "Open Loop Line");layer1.setAngles(angles1);// Set the line width to 2 pixelslayer1.setLineWidth(2);// Use 11 pixel diamond symbols for the data pointslayer1.setDataSymbol(cd.DiamondSymbol,11);// Set the line to open looplayer1.setCloseLoop(False);// Enable data label and set its formatlayer1.setDataLabelFormat("({value},{angle})");// Set the data label text box with light red (0xff9999) backgruond color and 1 pixel// 3D border effectlayer1.setDataLabelStyle().setBackground("0xff9999", cd.Transparent,1);// Output the chartchart1URL = c.makeSession(GetPageContext(),"chart1");// Include tool tip for the chartimageMap1 = c.getHTMLImageMap("","", "title='[{dataSetName}] ({radius}, {angle})'");</cfscript><html><body style="margin:5px 0px 0px 5px"><div style="font-size:18pt; font-family:verdana; font-weight:bold"> Polar Line Chart</div><hr style="border:solid 1px #000080"/><cfoutput><div style="font-size:9pt; font-family:verdana; margin-bottom:1.5em"> <a href='viewsource.cfm?file=#CGI.SCRIPT_NAME#'>View Source Code</a></div><img src="getchart.cfm?#chart1URL#"usemap="##map1" border="0" /><map name="map1">#imageMap1#</map></cfoutput></body></html>- Web图表开发-用ChartDirector画极线图
- Web图表开发--用ChartDirector画证券走势图
- JavaWeb ChartDirector 图表插件-web图表开发-ChartDirector资料
- Web图表开发-用ChartDirector画饼状图
- Web图表开发--用ChartDirector画线形图
- Web图表开发--在Pythonr下如何安装ChartDirector
- Web图表开发工具JFreeChart与ChartDirector选型
- Web图表开发工具JFreeChart与ChartDirector使用评测
- 好用的java web图表组件──chartdirector
- Web图表控件ChartDirector中文教程一
- Web图表控件ChartDirector中文教程二
- <译>Web图表工具ChartDirector基础教程
- 两大Web图表工具PK:JreeChart和ChartDirector
- ChartDirector图表组件使用与破解
- ChartDirector图表组件使用与破解
- ChartDirector图表组件使用与破解
- web开发图表(ichartjs组件开发)
- Python图表软件包ChartDirector的安装和使用
- Basic English (基本英语)
- coco2d-x中成员函数回调实现原理
- 英语口语场景-----问路篇
- js正则积累
- 前端开发利器—FIDDLER
- Web图表开发-用ChartDirector画极线图
- WCF学习(一):实例
- oracle 树结构数据层次分列显示
- MIPS 平台下 I/O 端口的读写--以龙芯为例
- Android之Adapter用法总结
- 作业调度框架 Quartz 学习笔记(六) -- job生病了(抛出异常)时的处理
- Ext.net 常见问题整理
- Warning: $HADOOP_HOME is deprecated. 关闭
- MTK wifi 驱动相关