Chart FX使用笔记
来源:互联网 发布:数据检索 编辑:程序博客网 时间:2024/05/01 20:12
由于项目的需要,试用了几个公司的图表控件,比如Dundas Chart,但是都觉得软件庞大,虽然功能也很强大,但是使用起来比较复杂,有很多功能实际用不上。
后来试用了.NET图表控件Chart FX,感觉不错,区区几行代码就可以Show出图表,以下是我写的一个例子:
1
2
3
4
5
6
7
8
9
10
11
12
13
14
15
16
17
18
19
20
21
22
23
24
25
26
27
28
29
30
31
32
33
34
35
36
37
38
39
40
41
42
43
44
45
46
47
48
49
50
51
52
53
54
55
56
57
58
59
60
61
62
63
64
65
66
67
68
69
70
71
72
73
74
75
76
77
78
79
80
81
82
83
84
85
86
87
88
89
90
91
92
93
94
95
96
97
98
99
100
101
102
103
104
105
106
107
108
109
110
111
112
113
114
115
116
117
118
119
120
121
122
123
124
125
126
127
128
129
130
131
132
133
134
135
136
137
138
139
140
141
142
143
144
145
146
147
148
149
150
151
152
153
154
155
156
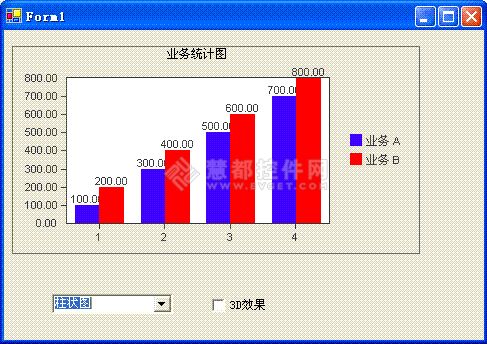
using System;using System.Drawing;using System.Collections;using System.ComponentModel;using System.Windows.Forms;using System.Data;using SoftwareFX.ChartFX.Lite;namespace ChartTest{ /**//// <summary> /// Form1 的摘要说明。 /// </summary> publicclassForm1 : System.Windows.Forms.Form { privateSoftwareFX.ChartFX.Lite.Chart chart1; privateSystem.Windows.Forms.ComboBox comboBox1; privateSystem.Windows.Forms.CheckBox checkBox1; /**//// <summary> /// 必需的设计器变量。 /// </summary> privateSystem.ComponentModel.Container components =null; publicForm1() { // // Windows 窗体设计器支持所必需的 // InitializeComponent(); // // TODO: 在 InitializeComponent 调用后添加任何构造函数代码 // } /**//// <summary> /// 清理所有正在使用的资源。 /// </summary> protectedoverridevoidDispose( bool disposing ) { if( disposing ) { if(components !=null) { components.Dispose(); } } base.Dispose( disposing ); } Windows 窗体设计器生成的代码#region Windows 窗体设计器生成的代码 /**//// <summary> /// 设计器支持所需的方法 - 不要使用代码编辑器修改 /// 此方法的内容。 /// </summary> privatevoidInitializeComponent() { this.chart1 =newSoftwareFX.ChartFX.Lite.Chart(); this.comboBox1 =newSystem.Windows.Forms.ComboBox(); this.checkBox1 =newSystem.Windows.Forms.CheckBox(); this.SuspendLayout(); // // chart1 // this.chart1.Location =newSystem.Drawing.Point(8,16); this.chart1.Name ="chart1"; this.chart1.Size =newSystem.Drawing.Size(408,208); this.chart1.TabIndex =0; // // comboBox1 // this.comboBox1.Items.AddRange(newobject[] { "柱状图", "饼图", "折线图"}); this.comboBox1.Location =newSystem.Drawing.Point(48,264); this.comboBox1.Name ="comboBox1"; this.comboBox1.Size =newSystem.Drawing.Size(121,20); this.comboBox1.TabIndex =1; this.comboBox1.Text ="请选择"; this.comboBox1.SelectedIndexChanged +=newSystem.EventHandler(this.comboBox1_SelectedIndexChanged); // // checkBox1 // this.checkBox1.Location =newSystem.Drawing.Point(208,264); this.checkBox1.Name ="checkBox1"; this.checkBox1.Size =newSystem.Drawing.Size(72,24); this.checkBox1.TabIndex =2; this.checkBox1.Text ="3D效果"; this.checkBox1.CheckedChanged +=newSystem.EventHandler(this.checkBox1_CheckedChanged); // // Form1 // this.AutoScaleBaseSize =newSystem.Drawing.Size(6,14); this.ClientSize =newSystem.Drawing.Size(480,310); this.Controls.Add(this.checkBox1); this.Controls.Add(this.comboBox1); this.Controls.Add(this.chart1); this.Name ="Form1"; this.Text ="Form1"; this.Load +=newSystem.EventHandler(this.Form1_Load); this.ResumeLayout(false); } #endregion /**//// <summary> /// 应用程序的主入口点。 /// </summary> [STAThread] staticvoidMain() { Application.Run(newForm1()); } privatevoidForm1_Load(object sender, System.EventArgs e) { chart1.OpenData(COD.Values,2,4); chart1.Value[0,0] = 100; chart1.Value[1,0] = 200; chart1.Value[0,1] = 300; chart1.Value[1,1] = 400; chart1.Value[0,2] = 500; chart1.Value[1,2] = 600; chart1.Value[0,3] = 700; chart1.Value[1,3] = 800; chart1.CloseData(COD.Values); chart1.Titles[0].Text ="业务统计图"; chart1.PointLabels =true; chart1.SerLegBox =true; chart1.SerLeg[0] ="业务 A"; chart1.SerLeg[1] ="业务 B"; } privatevoidcomboBox1_SelectedIndexChanged(object sender, System.EventArgs e) { if(comboBox1.SelectedIndex ==0) chart1.Gallery = Gallery.Bar; elseif(comboBox1.SelectedIndex ==1) chart1.Gallery = Gallery.Pie; elseif(comboBox1.SelectedIndex ==2) chart1.Gallery = Gallery.Lines; } privatevoidcheckBox1_CheckedChanged(object sender, System.EventArgs e) { if(checkBox1.Checked) chart1.Chart3D =true; else chart1.Chart3D =false; } }}运行效果如下图:
- Chart FX使用笔记
- 如何使用WPF图表控件Chart FX进行数据转换
- Chart FX for Java简介
- 如何在Chart FX for WPF 中使用Sketchflow原型显示图表
- Open Flash Chart使用笔记
- Chart FX for jAVA(1)---bar
- Chart FX for WPF绘制地图轮廓
- Chart FX for WPF绘制变化率
- WPF图表控件Chart FX使用方法汇总
- WPF for Chart FX最小化图例空间
- WPF for Chart FX创建Bullet图表
- JQ的chart.js使用笔记
- flex4 -- fx:Vector 使用
- jQuery入门-使用FX
- VS2005上VB.NET开发Chart FX控件
- Chart FX for JAVA (2)--------Lines AND Bar
- .Net图表开发控件Chart FX试用感受
- Chart FX for WPF发布v8.1版
- sql+datagridview 更新数据库
- 问题四十七: 有等式[※×(※3+※)]2=8※※9,其中※处为1个数字,滴上了墨水无法辨认
- 向国外投稿需要注意些下面几点
- 【Unity3D插件】NGUI屏幕自适应
- C# WebSocket 聊天室
- Chart FX使用笔记
- 学习笔记: cdq分治
- 关于vs2008上的socket链接错误问题
- 公告:CSDN新版首页上线
- ARM平台的ppp-2.4.4交叉编译
- 让ubuntu开机自启动小键盘
- Java 默认修饰符 总结
- JS window 窗口的操作
- new Date 在IE 下 兼容性的问题