All about oracle AWR...
来源:互联网 发布:算法导论和sicp 编辑:程序博客网 时间:2024/06/07 10:16
Oracle 10g之前对数据库做性能检测使用statspack工具。 关于statspack的说明,参考我的Blog:
Oracle Database 10g 提供了一个新的工具:(AWR:Automatic Workload Repository)。Oracle 建议用户用这个取代 Statspack。AWR 实质上是一个 Oracle 的内置工具,它采集与性能相关的统计数据,并从那些统计数据中导出性能量度,以跟踪潜在的问题。
与 Statspack 不同,快照由一个称为 MMON 的新的后台进程及其从进程自动地每小时采集一次。为了节省空间,采集的数据在 7 天后自动清除。快照频率和保留时间都可以由用户修改。它产生两种类型的输出:文本格式(类似于 Statspack 报表的文本格式但来自于 AWR 信息库)和默认的 HTML 格式(拥有到部分和子部分的所有超链接),从而提供了非常用户友好的报表。
AWR 使用几个表来存储采集的统计数据,所有的表都存储在新的名称为 SYSAUX 的特定表空间中的 SYS 模式下,并且以 WRM$_* 和 WRH$_* 的格式命名。前一种类型存储元数据信息(如检查的数据库和采集的快照),后一种类型保存实际采集的统计数据。H 代表“历史数据 (historical)”而 M 代表“元数据 (metadata)”。
在这些表上构建了几种带前缀 DBA_HIST_ 的视图,这些视图可以用来编写您自己的性能诊断工具。视图的名称直接与表相关;例如,视图 DBA_HIST_SYSMETRIC_SUMMARY 是在WRH$_SYSMETRIC_SUMMARY 表上构建的。
注意一点:
statistics_level 默认是typical,在10g中表监控是激活的,强烈建议在10g中此参数的值是typical。如果STATISTICS_LEVEL设置为basic,不仅不能监控表,而且将禁掉如下一些10g的新功能:
ASH(Active Session History)
ASSM(Automatic Shared Memory Management)
AWR(Automatic Workload Repository)
ADDM(Automatic Database Diagnostic Monitor)
在Oracle 11gR2里禁用的功能如下:
STATISTICS_LEVEL specifies the level of collection for database and operating system statistics. The Oracle Database collects these statistics for a variety of purposes, including making self-management decisions.
The default setting of TYPICAL ensures collection of all major statistics required for database self-management functionality and provides best overall performance. The default value should be adequate for most environments.
When the STATISTICS_LEVEL parameter is set to ALL, additional statistics are added to the set of statistics collected with the TYPICAL setting. The additional statistics are timed OS statistics and plan execution statistics.
Setting the STATISTICS_LEVEL parameter to BASIC disables the collection of many of the important statistics required by Oracle Database features and functionality, including:
Automatic Workload Repository (AWR) Snapshots
Automatic Database Diagnostic Monitor (ADDM)
All server-generated alerts
Automatic SGA Memory Management
Automatic optimizer statistics collection
Object level statistics
End to End Application Tracing (V$CLIENT_STATS)
Database time distribution statistics (V$SESS_TIME_MODEL and V$SYS_TIME_MODEL)
Service level statistics
Buffer cache advisory
MTTR advisory
Shared pool sizing advisory
Segment level statistics
PGA Target advisory
Timed statistics
Monitoring of statistics
二. AWR使用
SQL>@?/rdbms/admin/awrrpt.sql
Specify the Report Type
~~~~~~~~~~~~~~~~~~~~~~~
Would you like an HTML report, or a plain text report?
Enter 'html' for an HTML report, or 'text' for plain text
Defaults to 'html'
输入 report_type 的值:
Type Specified: html
Specify the number of days of snapshots to choose from
~~~~~~~~~~~~~~~~~~~~~~~~~~~~~~~~~~~~~~~~~~~~~~~~~~~~~~
Entering the number of days (n) will result in the most recent
(n) days of snapshots being listed. Pressing <return> without
specifying a number lists all completed snapshots.
输入 num_days 的值: 1
Listing the last day's Completed Snapshots
Snap
Instance DB Name Snap Id Snap Started Level
------------ ------------ --------- ------------------ -----
orcl10g ORCL10G 142 03 7月 2009 08:11 1
143 03 7月 2009 09:00 1
144 03 7月 2009 10:00 1
145 03 7月 2009 11:00 1
146 03 7月 2009 12:01 1
Specify the Begin and End Snapshot Ids
~~~~~~~~~~~~~~~~~~~~~~~~~~~~~~~~~~~~~~
输入 begin_snap 的值: 142
Begin Snapshot Id specified: 142
输入 end_snap 的值: 146
End Snapshot Id specified: 146
Specify the Report Name
~~~~~~~~~~~~~~~~~~~~~~~
The default report file name is awrrpt_1_142_146.html. To use this name,
press <return> to continue, otherwise enter an alternative.
输入 report_name 的值: D:/awrrpt_1_142_146.html
Report written to D:/awrrpt_1_142_146.html
三. AWR 操作
3.1. 查看当前的AWR保存策略
SQL> col SNAP_INTERVAL format a20
SQL> col RETENTION format a20
SQL> select * from dba_hist_wr_control;
DBID SNAP_INTERVAL RETENTION TOPNSQL
---------- -------------------- -------------------- ----------
262089084 +00000 01:00:00.0 +00007 00:00:00.0 DEFAULT
以上结果表示,每小时产生一个SNAPSHOT,保留7天。
3.2. 调整AWR配置
AWR配置都是通过dbms_workload_repository包进行配置。
3.2.1 调整AWR产生snapshot的频率和保留策略,如将收集间隔时间改为30 分钟一次。并且保留5天时间(单位都是分钟):
SQL> exec dbms_workload_repository.modify_snapshot_settings(interval=>30, retention=>5*24*60);
3.2.2 关闭AWR,把interval设为0则关闭自动捕捉快照
SQL> exec dbms_workload_repository.modify_snapshot_settings(interval=>0);
3.2.3 手工创建一个快照
SQL> exec DBMS_WORKLOAD_REPOSITORY.CREATE_SNAPSHOT();
3.2.4 查看快照
SQL> select * from sys.wrh$_active_session_history
3.2.5 手工删除指定范围的快照
SQL> exec DBMS_WORKLOAD_REPOSITORY.DROP_SNAPSHOT_RANGE(low_snap_id => 973, high_snap_id => 999, dbid => 262089084);
3.2.6 创建baseline,保存这些数据用于将来分析和比较
SQL> exec dbms_workload_repository.create_baseline(start_snap_id => 1003, end_snap_id => 1013, 'apply_interest_1');
3.2.7 删除baseline
SQL> exec DBMS_WORKLOAD_REPOSITORY.DROP_BASELINE(baseline_name => 'apply_interest_1', cascade => FALSE);
3.2.8 将AWR数据导出并迁移到其它数据库以便于以后分析
SQL> exec DBMS_SWRF_INTERNAL.AWR_EXTRACT(dmpfile => 'awr_data.dmp', mpdir => 'DIR_BDUMP', bid => 1003, eid => 1013);
3.2.9 迁移AWR数据文件到其他数据库
SQL> exec DBMS_SWRF_INTERNAL.AWR_LOAD(SCHNAME => 'AWR_TEST', dmpfile => 'awr_data.dmp', dmpdir => 'DIR_BDUMP');
把AWR数据转移到SYS模式中:
SQL> exec DBMS_SWRF_INTERNAL.MOVE_TO_AWR (SCHNAME => 'TEST');
四. AWR 报告分析
这部分内容,可以参考statspack,这2个内容都差不多。
4.1 SQL ordered by Elapsed Time
记录了执行总和时间的TOP SQL(请注意是监控范围内该SQL的执行时间总和,而不是单次SQL执行时间 Elapsed Time = CPU Time + Wait Time)。
Elapsed Time(S): SQL语句执行用总时长,此排序就是按照这个字段进行的。注意该时间不是单个SQL跑的时间,而是监控范围内SQL执行次数的总和时间。单位时间为秒。Elapsed Time = CPU Time + Wait Time
CPU Time(s): 为SQL语句执行时CPU占用时间总时长,此时间会小于等于Elapsed Time时间。单位时间为秒。
Executions: SQL语句在监控范围内的执行次数总计。
Elap per Exec(s): 执行一次SQL的平均时间。单位时间为秒。
% Total DB Time: 为SQL的Elapsed Time时间占数据库总时间的百分比。
SQL ID: SQL语句的ID编号,点击之后就能导航到下边的SQL详细列表中,点击IE的返回可以回到当前SQL ID的地方。
SQL Module: 显示该SQL是用什么方式连接到数据库执行的,如果是用SQL*Plus或者PL/SQL链接上来的那基本上都是有人在调试程序。一般用前台应用链接过来执行的sql该位置为空。
SQL Text: 简单的sql提示,详细的需要点击SQL ID。
4.2 SQL ordered by CPU Time:
记录了执行占CPU时间总和时间最长的TOP SQL(请注意是监控范围内该SQL的执行占CPU时间总和,而不是单次SQL执行时间)。
4.3 SQL ordered by Gets:
记录了执行占总buffer gets(逻辑IO)的TOP SQL(请注意是监控范围内该SQL的执行占Gets总和,而不是单次SQL执行所占的Gets)。
4.4 SQL ordered by Reads:
记录了执行占总磁盘物理读(物理IO)的TOP SQL(请注意是监控范围内该SQL的执行占磁盘物理读总和,而不是单次SQL执行所占的磁盘物理读)。
4.5 SQL ordered by Executions:
记录了按照SQL的执行次数排序的TOP SQL。该排序可以看出监控范围内的SQL执行次数。
4.6 SQL ordered by Parse Calls:
记录了SQL的软解析次数的TOP SQL。说到软解析(soft prase)和硬解析(hard prase),就不能不说一下Oracle对sql的处理过程。
4.7 SQL ordered by Sharable Memory:
记录了SQL占用library cache的大小的TOP SQL。Sharable Mem (b):占用library cache的大小,单位是byte。
4.8 SQL ordered by Version Count:
记录了SQL的打开子游标的TOP SQL。
4.9 SQL ordered by Cluster Wait Time:
记录了集群的等待时间的TOP SQL
Oracle have provided many performance gathering and reporting tools over the years. Originally the UTLBSTAT/UTLESTAT scripts were used to monitor performance metrics. Oracle8i introduced the Statspack functionality which Oracle9i extended. In Oracle 10g statspack has evolved into the Automatic Workload Repository (AWR).
- AWR Features
- Snapshots
- Baselines
- Workload Repository Views
- Workload Repository Reports
- Enterprise Manager
- Reading AWR Reports (Beginners Approach)
Related articles.
- AWR Baseline Enhancements in Oracle Database 11g Release 1
- Automatic Database Diagnostic Monitor (ADDM) in Oracle Database 10g
AWR Features
The AWR is used to collect performance statistics including:
- Wait events used to identify performance problems.
- Time model statistics indicating the amount of DB time associated with a process from the
V$SESS_TIME_MODELandV$SYS_TIME_MODELviews. - Active Session History (ASH) statistics from the
V$ACTIVE_SESSION_HISTORYview. - Some system and session statistics from the
V$SYSSTATandV$SESSTATviews. - Object usage statistics.
- Resource intensive SQL statements.
The repository is a source of information for several other Oracle 10g features including:
- Automatic Database Diagnostic Monitor
- SQL Tuning Advisor
- Undo Advisor
- Segment Advisor
Snapshots
By default snapshots of the relevant data are taken every hour and retained for 7 days. The default values for these settings can be altered using the following procedure.
BEGIN DBMS_WORKLOAD_REPOSITORY.modify_snapshot_settings( retention => 43200, -- Minutes (= 30 Days). Current value retained if NULL. interval => 30); -- Minutes. Current value retained if NULL.END;/
The changes to the settings are reflected in the DBA_HIST_WR_CONTROL view. Typically the retention period should capture at least one complete workload cycle. If you system has monthly archive and loads a 1 month retention time would be more beneficial that the default 7 days. An interval of "0" switches off snapshot collection, which in turn stops much of the self-tuning functionality, hence this is not recommended. Automatic collection is only possible if the STATISTICS_LEVEL parameter is set to TYPICAL or ALL. If the value is set to BASIC manual snapshots can be taken, but they will be missing some statistics.
Extra snapshots can be taken and existing snapshots can be removed, as shown below.
EXEC DBMS_WORKLOAD_REPOSITORY.create_snapshot;BEGIN DBMS_WORKLOAD_REPOSITORY.drop_snapshot_range ( low_snap_id => 22, high_snap_id => 32);END;/
Snapshot information can be queried from the DBA_HIST_SNAPSHOT view.
Baselines
A baseline is a pair of snapshots that represents a specific period of usage. Once baselines are defined they can be used to compare current performance against similar periods in the past. You may wish to create baseline to represent a period of batch processing.
BEGIN DBMS_WORKLOAD_REPOSITORY.create_baseline ( start_snap_id => 210, end_snap_id => 220, baseline_name => 'batch baseline');END;/
The pair of snapshots associated with a baseline are retained until the baseline is explicitly deleted.
BEGIN DBMS_WORKLOAD_REPOSITORY.drop_baseline ( baseline_name => 'batch baseline', cascade => FALSE); -- Deletes associated snapshots if TRUE.END;/
Baseline information can be queried from the DBA_HIST_BASELINE view.
Workload Repository Views
The following workload repository views are available:
V$ACTIVE_SESSION_HISTORY- Displays the active session history (ASH) sampled every second.V$METRIC- Displays metric information.V$METRICNAME- Displays the metrics associated with each metric group.V$METRIC_HISTORY- Displays historical metrics.V$METRICGROUP- Displays all metrics groups.DBA_HIST_ACTIVE_SESS_HISTORY- Displays the history contents of the active session history.DBA_HIST_BASELINE- Displays baseline information.DBA_HIST_DATABASE_INSTANCE- Displays database environment information.DBA_HIST_SNAPSHOT- Displays snapshot information.DBA_HIST_SQL_PLAN- Displays SQL execution plans.DBA_HIST_WR_CONTROL- Displays AWR settings.
Workload Repository Reports
Oracle provide two scripts to produce workload repository reports (awrrpt.sql and awrrpti.sql). They are similar in format to the statspack reports and give the option of HTML or plain text formats. The two reports give essential the same output but the awrrpti.sql allows you to select a single instance. The reports can be generated as follows.
@$ORACLE_HOME/rdbms/admin/awrrpt.sql@$ORACLE_HOME/rdbms/admin/awrrpti.sql
The scripts prompt you to enter the report format (html or text), the start snapshot id, the end snapshot id and the report filename. The resulting report can be opend in a browser or text editor accordingly.
An example of a HTML AWR report can be seen here.
Enterprise Manager
The automated workload repository administration tasks have been included in Enterprise Manager. The "Automatic Workload Repository" page is accessed from the main page by clicking on the "Administration" link, then the "Workload Repository" link under the "Workload" section. The page allows you to modify AWR settings or manage snapshots without using the PL/SQL APIs.
Reading AWR Reports (Beginners Approach)
If you are new to the AWR reports, the first thing you should probably do is run the ADDM report for the specific time period. The ADDM report provides root cause analysis of the parts of the system consuming the most time. It is often quicker to start with the ADDM report to help narrow down your area of focus in the AWR report.
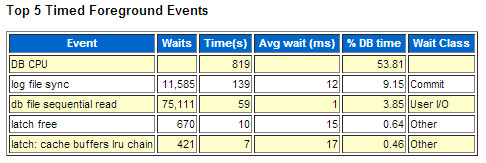
When looking at an AWR report, a good place to start is the "Top 5 Timed Foreground Events" section, near the top of the report. This gives you an indication of the bottlenecks in the system during this sample period.
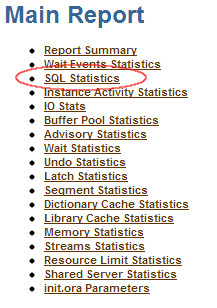
Once you've identified the top events, drill down to see what SQL and PL/SQL are consuming the majority of those resources. On the "Main Report" section, click the "SQL Statistics" link.
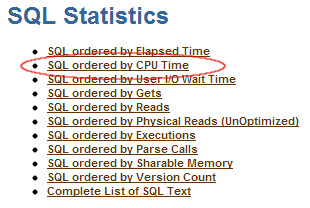
On the "SQL Statistics" section, click the "SQL ordered by ??" link that most closely relates to the wait event you identified in the "Top 5 Timed Foreground Events" section. In this case, the "DB CPU" was the top event, so it would seem sensible to try the "SQL ordered by CPU Time" link first.
You are then presented with the SQL and PL/SQL that are using most of the specified resource during the sample period. You can then attempt to tune these areas to reduce the impact.
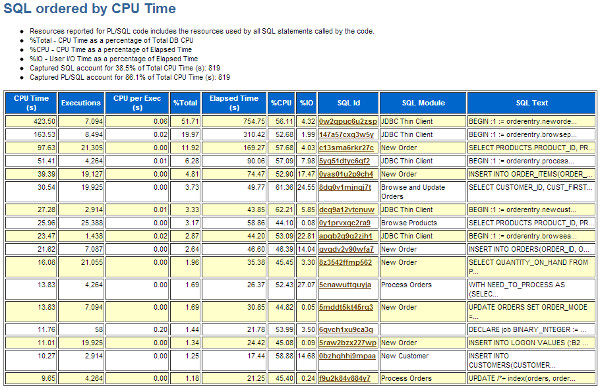
Repeat this process for the other top events.
Form more information see:
- AWR Baseline Enhancements in Oracle Database 11g Release 1
- Automatic Performance Statistics
- AWR Baseline Enhancements in Oracle Database 11g Release 1
- Automatic Database Diagnostic Monitor (ADDM) in Oracle Database 10g
http://www.oracle-base.com/articles/10g/automatic-workload-repository-10g.php
一段时间以来,Oracle 在这个领域中的解决方案是它内置的工具 Statspack。虽然某些情况下证明它是非常有价值的,但常常缺少性能故障诊断实践所需的强健性。Oracle Database 10g提供了一个显著改进的工具:自动工作负载信息库 (AWR)。AWR 和数据库一起安装,不但采集统计数据,还采集导出的量度。
快速测试驱动程序
通过运行 $ORACLE_HOME/rdbms/admin 目录中的 awrrpt.sql 脚本,AWR 的功能可以立即通过它从采集的统计数据和量度中生成的报表得到最好的说明。这个脚本从外观和感觉上类似于 Statspack,它显示所有的现有 AWR 快照并请求两个特定的快照作为时间间隔边界。它产生两种类型的输出:文本格式(类似于 Statspack 报表的文本格式但来自于 AWR 信息库)和默认的 HTML 格式(拥有到部分和子部分的所有超链接),从而提供了非常用户友好的报表。现在运行该脚本以查看报表,从而对 AWR 的功能有一个了解。
实施
现在,让我们来看看 AWR 是如何设计和构建的。AWR 实质上是一个 Oracle 的内置工具,它采集与性能相关的统计数据,并从那些统计数据中导出性能量度,以跟踪潜在的问题。与 Statspack 不同,快照由一个称为 MMON 的新的后台进程及其从进程自动地每小时采集一次。为了节省空间,采集的数据在 7 天后自动清除。快照频率和保留时间都可以由用户修改。要查看当前的设置,您可以使用下面的语句:
select snap_interval, retention
from dba_hist_wr_control;
SNAP_INTERVAL RETENTION
------------------- -------------------
+00000 01:00:00.0 +00007 00:00:00.0
这些 SQL 语句显示快照每小时采集一次,采集的数据保留 7 天。要修改设置—例如,快照时间间隔为 20 分钟,保留时间为两天—您可以发出以下命令。参数以分钟为单位。
begin
dbms_workload_repository.modify_snapshot_settings (
interval => 20,
retention => 2*24*60
);
end;
AWR 使用几个表来存储采集的统计数据,所有的表都存储在新的名称为 SYSAUX 的特定表空间中的 SYS 模式下,并且以WRM$_*和WRH$_*的格式命名。前一种类型存储元数据信息(如检查的数据库和采集的快照),后一种类型保存实际采集的统计数据。(您可能已经猜到,H 代表“历史数据 (historical)”而 M 代表“元数据 (metadata)”。)在这些表上构建了几种带前缀 DBA_HIST_ 的视图,这些视图可以用来编写您自己的性能诊断工具。视图的名称直接与表相关;例如,视图 DBA_HIST_SYSMETRIC_SUMMARY 是在WRH$_SYSMETRIC_SUMMARY 表上构建的。
AWR 历史表采集的信息比 Statspack 多许多,这些信息包括表空间使用率、文件系统使用率、甚至操作系统统计数据。这些表的完整的列表可以通过以下命令从数据字典中看到:
select view_name from user_views where view_name like 'DBA\_HIST\_%' escape '\';
视图 DBA_HIST_METRIC_NAME 定义 AWR 采集到的重要的量度、它们所属的组和采集它们的单位。例如,下面是一个记录(竖直格式):
DBID : 4133493568
GROUP_ID : 2
GROUP_NAME : System Metrics Long Duration
METRIC_ID : 2075
METRIC_NAME : CPU Usage Per Sec
METRIC_UNIT : CentiSeconds Per Second
它显示一个量度“每秒 CPU 使用率”以“每秒的厘秒数”为单位进行测量,并且该量度属于一个量度组 “System Metrics Long Duration”。这条记录可以和其它的表(如 DBA_HIST_SYSMETRIC_SUMMARY)结合,以获得数据库的活动信息,形式如下:
select begin_time, intsize, num_interval, minval, maxval, average, standard_deviation sd
from dba_hist_sysmetric_summary where metric_id = 2075;
BEGIN INTSIZE NUM_INTERVAL MINVAL MAXVAL AVERAGE SD
----- ---------- ------------ ------- ------- -------- ----------
11:39 179916 30 0 33 3 9.81553548
11:09 180023 30 21 35 28 5.91543912
... and so on ...
下面我们看看 CPU 时间是如何消耗的(以厘秒为单位)。标准差加入到了我们的分析中,它有助于确定平均数字是否反映了实际的工作负载。在第一条记录中,平均值是每秒消耗 CPU 时间 3 厘秒,但标准差是 9.81,这意味着平均值 3 不能反映工作负载。在第二个例子中,平均值为 28,标准差为 5.9,这更具有代表性。这种类型的信息趋势有助于了解几个环境参数对性能量度的影响。
使用统计数据
迄今为止,我们看到了 AWR 所采集的内容,现在让我们看看它将如何处理数据。
大多数性能问题并不是孤立存在的,而留有指示性的迹象,这些迹象将通向问题最终的根源。让我们使用一个典型的调整实践来说明这一点:您注意到系统很慢,于是决定查看等待的原因。您检查发现“缓冲区忙等待”非常高。问题可能出在哪里呢?有几种可能:可能有一个单调增加的索引,可能一个表太满了,以至于要求将单个数据块非常快速地加载到内存中,或其它一些因素。无论在哪种情况下,您都首先要确定存在问题的段。如果它是一个索引段,那么您可以决定重新构建它,把它修改为一个反向键索引,或把它转换成一个在 Oracle Database 10g中引进的散列分区索引。如果它是一个表,您可以考虑修改存储参数来使它不那么密集,或者利用自动段空间管理把它转移到一个表空间中。
您的处理计划一般是有规律的,并且通常基于您对各种事件的了解和您处理它们的经验。现在设想相同的事情由一个引擎来完成,这个引擎采集量度并根据预先确定的逻辑来推出可能的计划。您的工作不就变得更轻松了吗?
现在在 Oracle Database 10g中推出的这个引擎称为自动数据库诊断监控程序 (ADDM)。为了作出决策,ADDM 使用了由 AWR 采集的数据。在上面的讨论中,ADDM 可以看到发生了缓冲区忙等待,然后取出相应的数据来查看发生缓冲区忙等待的段,评估其特性和成分,最后为数据库管理员提供解决方案。在 AWR 进行的每一次快照采集之后,调用 ADDM 来检查量度并生成建议。因此,实际上您拥有了一个一天二十四小时工作的自动数据库管理员,它主动地分析数据并生成建议,从而把您解放出来,使您能够关注更具有战略意义的问题。
要查看 ADDM 建议和 AWR 信息库数据,请使用在名称为 DB Home 的页面上的新的 Enterprise Manager 10g控制台。要查看 AWR 报表,您可以从管理转至工作负载信息库,然后转至 Snapshots 来查看它们。在以后的部分中,我们将更详细地讨论 ADDM。
您还可以指定根据特定的情况来生成警报。这些警报称为服务器生成警报,它们被推送到高级队列中,在其中它们可以被任意监听它的客户端使用。一个这样的客户端是 Enterprise Manager 10g,在其中警报被突出显示。
时间模型
当您有性能问题时,要缩短响应时间您最先想到的是什么?很明显,您希望消除(或减少)增加时间的因素的根源。您如何知道时间花费在哪里—不是等待,而是真正在进行工作?
Oracle Database 10g引进了时间模型,以确定在各个地方花费的时间。花费的总的系统时间记录在视图V$SYS_TIME_MODEL中。下面是查询和输出结果。
STAT_NAME VALUE
------------------------------------- --------------
DB time 58211645
DB CPU 54500000
background cpu time 254490000
sequence load elapsed time 0
parse time elapsed 1867816
hard parse elapsed time 1758922
sql execute elapsed time 57632352
connection management call elapsed time 288819
failed parse elapsed time 50794
hard parse (sharing criteria) elapsed time 220345
hard parse (bind mismatch) elapsed time 5040
PL/SQL execution elapsed time 197792
inbound PL/SQL rpc elapsed time 0
PL/SQL compilation elapsed time 593992
Java execution elapsed time 0
bind/define call elapsed time 0
注意名称为 DB Time 的统计量,它代表自从例程启动起在数据库中花费的时间。运行示例工作负载,并再次从视图中选中统计值。统计值的差异将代表该工作负载在数据库中花费的时间。在又一个调整回合之后,执行相同的分析,统计值的差异将显示在调整之后 DB Time 的变化,这可以与第一次修改进行比较,以查看调整动作对数据库时间的影响。
除数据库时间之外,V$SYS_TIME_MODEL视图显示了很多其它的统计量,如在不同类型的分析,甚至在 PL/SQL 编译中花费的时间。
这个视图还显示了总的系统时间,不过您可能对一个更加详细的视图感兴趣:会话级时间。时间统计数据还在会话级进行采集,如视图V$SESS_TIME_MODEL中所示,在其中可以看到当前连接的会话(活动和不活动的)的所有统计数据。额外的列 SID 指示显示的统计数据的会话的 SID。
在早期的版本中,这种分析是不可能得到的,用户被迫进行猜测或从各种来源进行分析。在 Oracle Database 10g中,获得这种信息轻而易举。
活动会话历史
Oracle Database 10g中的视图V$SESSION得到了改善;所有这些改善中最有价值的是包含了等待事件和它们的持续时间,从而不再需要查看视图 V$SESSION_WAIT。不过,因为这个视图只反映实时的值,所以当稍后查看它时,一些重要的信息丢失了。例如,如果您选择从这个视图中检查是否有任何会话在等待任何非空闲的事件,如果有的话,调查这个事件,您可能发现不了任何东西,因为到您选中它的时候等待一定已经结束了。
进入新的特性活动会话历史 (ASH),它类似于 AWR,在一个缓冲区中存储会话性能统计数据,以便稍后进行分析。不过,与 AWR 不同,存储不是永久性地在一个表中进行,而是在内存中进行,并在视图V$ACTIVE_SESSION_HISTORY中显示。数据每秒轮询一次,并且只有轮询活动会话。随着时间进行,旧的项目在一个循环缓冲区中被删除,以容纳新的项目,并且这些旧的项目将在视图中显示。要找出有多少个会话在等待某些事件,您可以使用下面的命令
select session_id||','||session_serial# SID, n.name, wait_time, time_waited
from v$active_session_history a, v$event_name n
where n.event# = a.event#
这条命令告诉您事件的名称和等待花费了多少时间。如果您想要深入调查某个特定的等待事件,ASH 的额外的列也将帮助您实现这一目的。例如,如果会话等待的事件之一是缓冲区忙等待,那么正确的诊断必须指出发生等待事件的段。您可以从 ASH 视图列 CURRENT_OBJ# 中获得这一信息,然后该列可以和 DBA_OBJECTS 结合,以获得存在问题的段。
ASH 还记录并行查询服务器会话,这对诊断并行查询等待事件非常有用。如果记录是针对一个并行查询从属进程,那么协调服务器会话的 SID 由 QC_SESSION_ID 列指定。列 SQL_ID 记录产生等待事件的 SQL 语句的 ID,该列可以和 V$SQL 视图结合,以获取存在问题的 SQL 语句。为了方便一个共享用户环境(如 web 应用程序)中的客户端的识别,也显示了 CLIENT_ID 列,这可以由 DBMS_SESSION.SET_IDENTIFIER 来设置。
既然 ASH 信息这么有价值,那么如果以一种类似于 AWR 的永久方式来保存这种信息不是很好吗?幸运的是,它是以这种方式来进行保存的;由 MMON 从进程将信息刷新到 AWR 表中,从而保存在磁盘上,并且信息可以通过视图DBA_HIST_ACTIVE_SESS_HISTORY来查看。
人工采集
快照默认是自动采集的,但您也可以按需要采集它们。所有的 AWR 功能都在程序包DBMS_WORKLOAD_REPOSITORY中实施。要采集一次快照,只需发出下面的命令:
execute dbms_workload_repository.create_snapshot
它立即采集一次快照,快照被记录在表 WRM$_SNAPSHOT 中。采集的量度是针对TYPICAL级别的。如果您想采集更详细的统计数据,您可以在上面的过程中将参数FLUSH_LEVEL设置为ALL。统计数据自动删除,但也可以通过调用过程drop_snapshot_range()来手动删除。
基准线
一次典型的性能调整实践从采集量度的基准线集合、作出改动、然后采集另一个基准线集合开始。可以比较这两个集合来检查所作的改动的效果。在 AWR 中,对现有的已采集的快照可以执行相同类型的比较。假定一个名称为 apply_interest 的高度资源密集的进程在下午 1:00 到 3:00 之间运行,对应快照 ID 56 到 59。我们可以为这些快照定义一个名称为 apply_interest_1 的基准线:
exec dbms_workload_repository.create_baseline (56,59,'apply_interest_1')
这一操作将快照从 56 到 59 编号,作为上面指定的基准线的一部分。查看现有的基准线:
select * from dba_hist_baseline;
DBID BASELINE_ID BASELINE_NAME START_SNAP_ID END_SNAP_ID
---------- ----------- -------------------- ------------- -----------
4133493568 1 apply_interest_1 56 59
在一些调整步骤之后,我们可以创建另一个基准线—假设名称为 apply_interest_2,然后只为那些与这两条基准线相关的快照比较量度。像这样把快照分隔在仅仅几个集合中有助于研究调整对于性能量度的影响。您可以在分析之后使用drop_baseline()来删除基准线;快照将保留。此外,当清除例程开始删除旧的快照时,与基准线相关的快照不会被清除,从而允许进行进一步的分析。
结论
这一部分的目的只是介绍 AWR 非常基本的方面。关于更完整的内容,请参见 Oracle Database 10g文档。此外,关于 AWR 和 ADDM 的一个极好的论述可以在技术白皮书自我管理的数据库:自动性能诊断中找到。在第 15 周,您将了解到关于 ADDM 及使用它来解决实际问题的更多内容 。
- All about oracle AWR...
- All about oracle profile
- All about oracle process
- all about oracle ASM
- All about Oracle RAC Failover
- All about Oracle IMP/EXP
- All about Oracle Character Set
- all about oracle logic IO
- all about oracle block corruption
- All about Oracle FED and KFOD tools
- All about Oracle ASM,ASM知识索引
- All about oracle smallfile and bigfile tablespace
- All about Oracle User-Managed Database Backups
- All about control file in Oracle Database
- all about Oracle memory - 错误处理
- all about Oracle Database PSU/CPU
- All about "about face"
- Oracle AWR
- 关于重启tomcat出现java.io.WriteAbortedException的原因和解决方法
- iOS SDK基础知识:UITextView & UITextViewDelegate
- 求1+2+3+..+n 和1*2*3*...*n递归
- Oracle Hint
- 由点派生直线
- All about oracle AWR...
- Linux 下 strace 命令用法总结
- Wince 下C#使用INI文件
- apt-get update ,upgarde 和dist-upgrade
- 第十一周上机任务项目一
- Android onTouch事件解析
- SVN如何打分支(Eclipse插件)
- Android4.0的StatusBar和NavigationBar
- XCode4.5免证书真机调试解决 failed to get the task for process xxx