js制作图表(dygraphs)
来源:互联网 发布:软件配置管理论坛 编辑:程序博客网 时间:2024/05/05 10:39
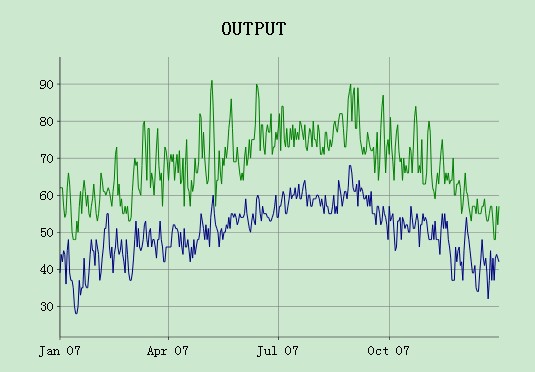
dygraphs 是一个开源的Javascript库,它可以产生一个可交互式的,可缩放的的曲线表。其可以用来显示大密度的数据集(比如股票,气温,等等),并且可以让 用户来浏览和解释这个曲线图。在它的主页,你可以看到一些示例和用法。
简单示例:
<html><head> <script type="text/javascript" src="dygraph-combined.js"></script></head><body><div id="graphdiv"></div><script type="text/javascript"> g = new Dygraph( // containing div document.getElementById("graphdiv"), // CSV or path to a CSV file. "Date,Temperature\n" + "2008-05-07,75\n" + "2008-05-08,70\n" + "2008-05-09,80\n" );</script></body></html>
官方网站:http://dygraphs.com/
- js制作图表(dygraphs)
- dygraphs示例(图表插件)
- dygraphs的学习-----------------dygraphs插件(图表插件)
- d3.js制作动态图表
- 50种制作图表JS库
- js统计图表制作圆环图
- chatr.js 制作漂亮的图表
- 图表制作(JFreeCha)说明
- Piktochart(制作信息图表)
- 制作图表
- 使用D3制作统计图表、线性图表、水平柱状图表、饼图 -- (一)线性图表
- 使用D3制作统计图表、线性图表、水平柱状图表、饼图 -- (二)面积图表
- 使用D3制作统计图表、线性图表、水平柱状图表、饼图 -- (三)竖直柱状图表
- 使用D3制作统计图表、线性图表、水平柱状图表、饼图 -- (五)饼状图表
- d3.js——面积图表的制作
- 水晶报表的制作(图表)
- 使用D3制作图表(一)
- 使用D3制作图表(二)
- 数组外包装为STL容器
- 调用一个Activity(“显式调用”与“隐式调用”)
- 杭电1880
- 利用ndk交叉编译x264到arm平台(带neon版本)
- Google Map API使用详解(一)——Google Map开发背景知识
- js制作图表(dygraphs)
- 将所给数组中的负数安排在左边,零安排在中间,正数安排在右边
- Linux系统开机启动过程
- Timestamp与java.util.date进行比较的问题
- Google Map API使用详解(四)——Google Map基本常识(中)
- jsessionid 对JAVA WEB jsessionid的剖析
- C#抽象方法与虚拟方法的区别
- mysql数据库取得某一段时间内的纪录
- list remove泛型问题-----毕业设计遇到的问题综合总结