Flash图表组件FusionCharts帮助文档七:加载多个图表文件
来源:互联网 发布:英文网络用语 编辑:程序博客网 时间:2024/05/16 18:56
要在flash动画中加载两个或多个 FusionCharts 图表文件,只需为每个图表类创建一个实例,提供相应的XML数据然后将它呈现出来就可以了,非常简单。
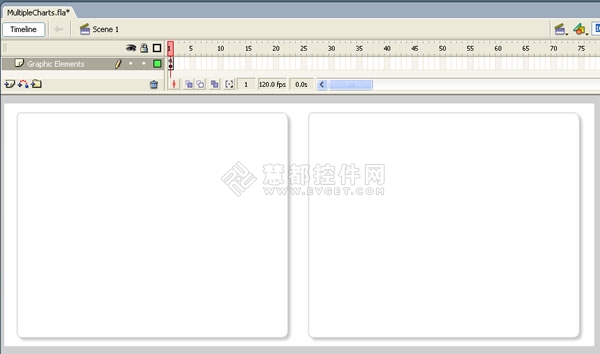
在本例中,我们在FlashExamples文件夹下创建MultipleCharts.fla,然后再在这个新创建的文件夹下创建一层 "Graphic Elements",添加两个圆角矩形的背景框,用来加载两个图表,如图所示:
示例代码:
//You first need to include the following two files in your movie.//These two files contain pre-loading functions and application//messages for the chart.//Note: If you're loading multiple charts in your Flash movie, you//do NOT need to include these files for each chart. You can put these//lines in the main timeline, so that it gets loaded only once.#include "com/fusioncharts/includes/LoadingFunctions.as"#include "com/fusioncharts/includes/AppMessages.as"//To create the chart, you now need to import the Class of the //chart which you want to create. All charts are present in the package //com.fusioncharts.core.charts (Download Package > SourceCode folder)//If you're using multiple charts, you can import all the requisite//chart classes in the main timeline of your movie. That way, you//will not have to import the chart classes everytime you wish to use.import com.fusioncharts.core.charts.Column2DChart;import com.fusioncharts.core.charts.Line2DChart;// ------------- XML Data for the charts -------------- ////Data for chart 1var strXML1:String = "<chart showBorder='0' bgAlpha='0,0' palette='1' caption='Hourly Working Rate' numberPrefix='$'>";//Add simple data for demo.strXML1 = strXML1+"<set label='John' value='32' />";strXML1 = strXML1+"<set label='Mary' value='65' />";strXML1 = strXML1+"<set label='Michelle' value='29' />";strXML1 = strXML1+"<set label='Cary' value='43' />";strXML1 = strXML1+"</chart>";var xmlData1:XML = new XML(strXML1);// Data for Chart 2var strXML2:String = "<chart showBorder='0' bgAlpha='0,0' palette='1' caption='Hours Worked Last week' canvasPadding='20'>";//Add simple data for demo.strXML2 = strXML2+"<set label='John' value='49' />";strXML2 = strXML2+"<set label='Mary' value='34' />";strXML2 = strXML2+"<set label='Michelle' value='61' />";strXML2 = strXML2+"<set label='Cary' value='40' />";strXML2 = strXML2+"</chart>";var xmlData2:XML = new XML(strXML2);// --------------------------------------------------- // // -------------- Actual Code to create the chart ------------////Create movie clips required for both the chartsvar chartContainer1MC:MovieClip = this.createEmptyMovieClip("ChartHolder1", 1);var chartContainer2MC:MovieClip = this.createEmptyMovieClip("ChartHolder2", 2);//Now, instantiate the charts using Constructor function of the chart.var chart1:Column2DChart = new Column2DChart(chartContainer1MC, 1, 380, 325, 20, 15, false, "EN", "noScale");var chart2:Line2DChart = new Line2DChart(chartContainer2MC, 1, 380, 325, 440, 15, false, "EN", "noScale");//Convey the XML data to chart. chart1.setXMLData(xmlData1);chart2.setXMLData(xmlData2);//Draw the chartschart1.render();chart2.render();//Stopstop();解释一下上面的代码:
1、首先加进了com/fusioncharts/includes/LoadingFunctions.as &com/fusioncharts/includes/AppMessages.as ,预加载图表所需的文件;
2、然后,我们要绘制两个图表,所以导入Column2DChart 类和Line2DChart 类;
3、为两个图表创建XML数据(在此例中,是硬编码的XML数据),你也可以根据数据源动态创建XML数据;
4、将XML数据转换为XML对象;
5、然后为两个图表分别创建两个空的动画片段;
6、为两个图表创建实例以及所需的参数。设置x和y轴平移线以便在柱状图右边绘制;
7、用setXMLData 传递XML数据;
8、最后,向每个图表的实例对象调用 render() 方法,绘制两个图表。
查看应用程序,输出效果如下图:

在本例中,我们只加载了2D柱状图和线形图,你也可以加载FusionCharts的其他图表类型。另外,你还可以加载任意数量的图表到你的应用程序中。
- Flash图表组件FusionCharts帮助文档七:加载多个图表文件
- Flash图表组件FusionCharts帮助文档汇总
- Flash图表组件FusionCharts帮助文档十二:创建透明图表
- Flash图表组件FusionCharts帮助文档九:网格组件用法
- Flash图表组件FusionCharts帮助文档五:用BOM实现多语言(UTF-8)
- Flash图表组件FusionCharts帮助文档三:在iPhone/iPad中生成JavaScript图表
- Flash图表组件FusionCharts帮助文档四:在图表中添加货币符号
- Flash图表组件FusionCharts帮助文档十一:Excel静态数据变为动态图表
- Flash图表组件FusionCharts帮助文档十三:调整图表比例(百分比)
- FusionCharts加载多个flash图表的方法
- Flash图表组件FusionCharts帮助文档一:调用静态方法RenderChart
- Flash图表组件FusionCharts帮助文档一:调用静态方法RenderChart
- Flash图表组件FusionCharts帮助文档二:为饼图/环形图添加图例
- Flash图表组件FusionCharts帮助文档六:在地图上作标记
- Flash图表组件FusionCharts帮助文档八:添加向下钻取链接
- Flash图表组件FusionCharts帮助文档十:将柱状图转换为饼状图
- Flash图表FusionCharts帮助文档(持续更新中)
- 基于Flash的图表组件-FusionCharts
- 好的安卓博客
- Flash图表组件FusionCharts帮助文档三:在iPhone/iPad中生成JavaScript图表
- Flash图表组件FusionCharts帮助文档四:在图表中添加货币符号
- Flash图表组件FusionCharts帮助文档五:用BOM实现多语言(UTF-8)
- Flash图表组件FusionCharts帮助文档六:在地图上作标记
- Flash图表组件FusionCharts帮助文档七:加载多个图表文件
- Flash图表组件FusionCharts帮助文档八:添加向下钻取链接
- Flash图表组件FusionCharts帮助文档九:网格组件用法
- TOJ Right Triangles II
- ARM MMU工作原理剖析
- Flash图表组件FusionCharts帮助文档十:将柱状图转换为饼状图
- TwinCAT与AMD的处理器的不兼容问题
- Flash图表组件FusionCharts帮助文档十一:Excel静态数据变为动态图表
- Flash图表组件FusionCharts帮助文档十二:创建透明图表