Finding Windows CE bugs with help from "Dr. Watson"
来源:互联网 发布:大唐软件 编辑:程序博客网 时间:2024/05/01 11:52
WinCE下错误报告的用法
仔细看了昨晚搜刮到的那篇关于WinCE错误报告的文章,受益匪浅。使用流程已经介绍得足够详细,这里不再赘述。需要参考的同志,请直接看原文。这里补充一点原文中貌似没讲到的,个人觉得很关键的地方,如何在产品中保留错误报告。
那篇文章中提到要将错误报告从Windows的目录下拷贝到别的非易失性的存储器中,以便后续的分析与处理。这在开发过程中是没有问题的。但如果产品已经发布,我们需要从客户的设备中获取错误报告,就行不通了。
最初测试时发现,当应用程序出错时会在Windows的目录下生成错误报告,但选择“不发送”,从而关闭“错误报告”对话框后,生成的错误报告文件被自动删除。我想原文之所以说要拷贝出来,大概就是这个原因。很显然,我们需要将该目录直接挪到SD卡或者NAND目录中,并且阻止系统自动删除该文件。
尝试了半天,终于找到了解决办法,修改注册表的相关键值即可。需要修改的主要有以下两项。

"DumpDirectory"="\\Windows\\DumpFiles" ;此处修改为指定的目录
"ExtraFilesDirectory"="\\Windows\\ExtraDumpFiles" ;此处修改为指定的目录
"CabDirectory"="\\Windows\\DumpFiles\\CabFiles" ;此处修改为指定的目录
"UploadClient"="\\Windows\\Dw.exe"
"MaxDiskUsage"=dword:80000
"DumpEnabled"=dword:1
[HKEY_LOCAL_MACHINE\System\ErrorReporting\UploadSettings]
"NoConsentRequired"=dword:0 ;此处修改为1,取消弹出提示框
"DontUpload"=dword:0 ;此处修改为1,取消上传及自动删除,使其保留在目录中
"MaxWeeklyReports"=dword:0
"MaxDailyReports"=dword:0
"UploadSucceededDlg"=dword:0
"UploadFailedDlg"=dword:0
[HKEY_LOCAL_MACHINE\init]
"Launch95"="dw.exe" ;删除该项,禁止该程序自启动
另外,需要在指定的目录下创建Dumpfiles的目录,否则错误报告也不能正确生成,特别需要注意这一点。所有的配置正确后,再次运行Crash.exe,就可以在B:\Dumpfiles\Ce092009-01目录下生成一个名为Ce092009-01.kdmp的文件。我是在模拟器中测试的,将B:\(Ramdisk)用做模拟器的Storage Card,所以是在该目录下生成了该文件。下面就可以用WinDgb工具进行分析获得的错误报告了。先设定源代码目录、映像目录、符号文件目录,然后打开Ce092009-01.kdmp文件,就可以在源代码中定位到出错的位置,如下图所示。

至此,这个BUG就一目了然了,Fix也是很容易的事。
折腾了大半天,最后发现其实改动很小,仅仅是注册表中的几个键值。可不折腾,又怎么知道修改什么地方,怎么修改呢?最近调试一个新的开发板,也有同样的感受,最后修改也许很简单,但如何定位到这个需要修改的地方及如何修改则需要花很多时间。不过没关系,我还是挺爱折腾这些的。
昨天折腾了一个左道,应该能缓解一下目前存在的问题。今天折腾了一个正道,应该能有助于问题的最终解决,双管齐下,希望能让产品更稳定。
WinDbg的下载地址:http://msdl.microsoft.com/download/symbols/debuggers/dbg_x86_6.11.1.402.msi,它是一个很强大的工具,用好了也是一门学问,有时间再进一步学习。_____________________________________________________________________________________________________________
by Abraham Kcholi and Gad Meir
Introduction
Because we believe that we are perfect, it follows that we create perfect software![]() . Therefore, it is thehardware's fault when our systems crash. By "systems," of course, we're referring to the combination ofhardware
. Therefore, it is thehardware's fault when our systems crash. By "systems," of course, we're referring to the combination ofhardware![]() , operating system, and applications that comprise the whole embedded system.
, operating system, and applications that comprise the whole embedded system.
The scenario goes like this... We deliver the system to the client, get paid (hopefully), and then a week later, we get a nervous call in the middle of the night: "Your system crashed."
Trying to get oriented and open our eyes, we start to query the person on the other end of the line regarding what really occurred, and we end up realizing that something caused the system to crash. We promise to start investigating the problem first thing in the morning. But our beauty sleep has now evaporated, and it's time to go and trace that crash.
If only we had incorporated the Windows Error Reporting (WER) module, into our system! This would have let us retrieve the state of our device at the time the program crashed. More than that, we could have uploaded it from the device, stuck it in WinDbg, and determined the exact line where our mischievous code broke down.
Motivation
As is usually the case, demonstrating this new feature of Windows CE 5.0 is the best way to explain what it does and illustrate its usefulness. Our scenario assumes you developed a program or module running on a Windows CE 5.0 based device, the program is installed on thousands of units, and complaints are flowing in from end users that the application sometimes crashes. Wouldn't it be nice to know exactly why each crash happens, to the level of having a stack trace with the source code line number and the value of local variables at the point of the crash? Well, WER gives you just that.
Our application can be any application, whether native or managed. To demonstrate that it could be any type of application, we will use a simple console application running on a Pocket PC device, but it could be a Windows application, or a special purpose Windows CE module.
The process we are going to describe is CPU agnostic and can be used for any type of hardware running Windows CE 5.0.
Here is the source code of our sample culprit application:
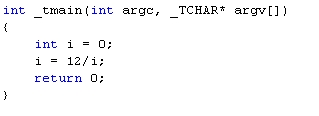
Figure 1
After deploying the application onto the device, running the application will obviously cause a divide-by-zero exception. Since our device has the Error Reporting feature incorporated into its image, a polite message will pop up, asking the user if he or she would like to share their unfortunate experience of that offensive application with Microsoft.

Figure 2
There are two links on the page. Let's examine the second link a little bit further: the link indicated by "To View technical information contained in this error report."

Figure 3
It looks like two files are about to be uploaded. Clicking each of the links, to find out more about what is sent, yields:

Figure 4
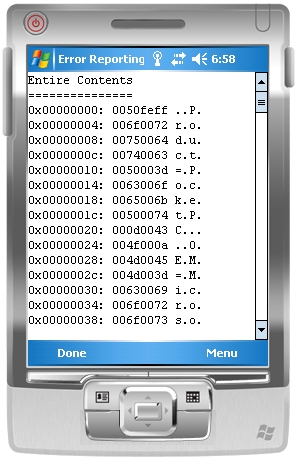
Figure 5
The first looks like a report, and the second looks like a memory dump.
Later in the article, we'll see how this information can travel from Microsoft buckets directly to your product support FTP. For now, let's dig a little bit into the CE device file system.
We're interested specifically in the My Device/Windows/System/DumpFiles folder. It is a hidden folder, so you'll need to set show all for the file explorer to view it.

Figure 6
In this folder, you are going to find another folder with the prefix "CE," the date of the application crash in the format "MMDDYY," and a sequence number, in case you are lucky enough to have several applications crash on the same day. In that folder, you can find one or two files that are actually the sources of the data you have seen previously in the Windows CE ER reports.
Since those file are deleted after you make up your mind about sending the report to Microsoft, let's copy that folder to a safe place for further examination (copy and paste to another folder, or to an SD card).
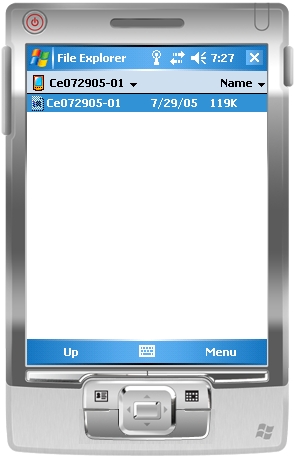
Figure 7
Assuming you got the dump somehow -- from Microsoft, from your customer, or you grabbed it yourself from the customer's device during maintenance -- let's see what can be learned from that dump.
Some sort of analysis tool is needed in order to analyze the dump, and the best one is WinDbg. WinDbg is included in the "debugging tools for windows" package, freely available from the Microsoft WHDC site. We'll talk more about that package later, but first we must set the stage.
We need access to the source code of our application; we need the symbol files produced by the compiler and the application image (exe file). Since we created that program in the first place, it's probably a very straightforward process to get it onto our workstation. So, assuming we installed and configured on our workstation with the needed tools, lets start the analysis process:
- Start WinDbg
- Drag and drop the dump onto the WinDbg window
Assuming everything is set up correctly, the result would be as shown in Figure 8.
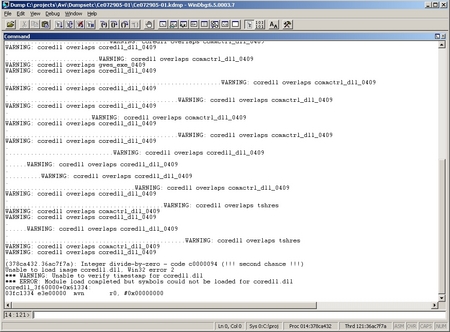
Figure 8
(Click to enlarge)
It becomes clear that it may be a divide-by-zero exception:

(Click to enlarge)
The assembly snippet shows the exact command that caused the crash. However that's just the beginning. Let's click the stack trace button:
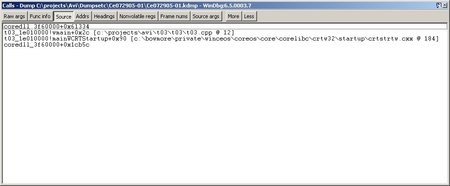
Figure 9
(Click to enlarge)
As can be seen, we can tell the exact source file and line number that are causing the problem -- and that's not the end of the story. If we move to the stack frame in our program, we can open up a new source window with the faulty line clearly marked:
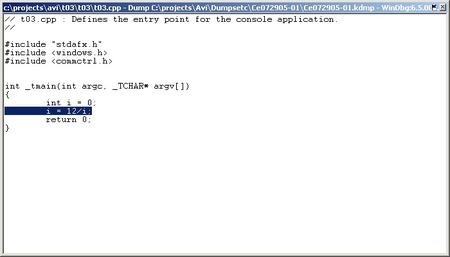
Figure 10
(Click to enlarge)
And, last but not least, the locals window is going to give us the local values at that frame, including the value of "i":
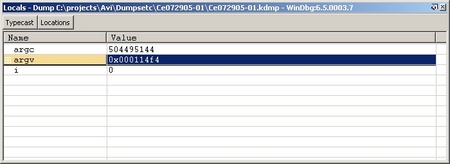
Figure 11
(Click to enlarge)
It's very tempting to change the value of "i" and retry the application in the debugger, but there are several practical reasons why you can't do that.
First, the host workstation we are using to analyze the data is most likely an x86-based computer, whereas the target device may be an ARM-based device or a MIPS-based device, etc., and although it looks like a live debugging session, you are actually debugging a piece of dump memory created automatically for you by the Windows CE WER function. Nevertheless, if you can get the dump to your analyzing machine, you can tell exactly what happened to your app at the moment of the crash, which is the primary motivation for the article you are reading right now.
By the way, if you are too lazy to remember all those debugger commands, just remember one command. The!analyze -v command. The following output of that command might explain why it is probably the most useful command in WinDbg:

Figure 12
(Click to enlarge)
Adding Error reporting to the image
Among Windows CE 5.0's most interesting new features is a set of error reporting components that we can add to our image. There are four components that can be added to the image from the catalog. The report upload component, however, can either provide a graphic user interface or not. In Figure 13, a view of error reporting catalog items is shown.
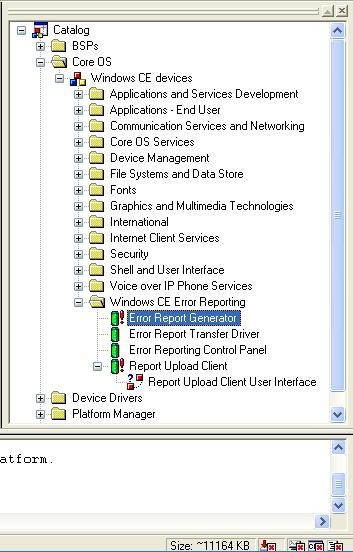
Figure 13
With error reporting incorporated into our device, when a program crashes, the device will automatically save the state of the device at the point in time the program crashed. The error report generator will save a dump file, which includes some very useful information that should be helpful in eliminating bugs that escaped the testing process.
Error Report Generator
The Error Report Generator is the component responsible for the creation of dump files using the configuration options set in the registry.
The dump file formats are compatible with the requirements of Microsoft's Watson website. This enables the uploading server to handle classification of -- and reporting of -- the uploaded dump files.
To generate an error report dump file, at least 128KB of memory must be reserved. The OAL developer initializes the size of the memory to be reserved by setting a variable named dwNKDrWatsonSize. This is done in the OEMInit function, as shown in Figure 14.
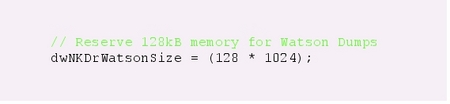
Figure 14
(Click to enlarge)
The kernel will use this size to reserve a block of memory at the end of the main memory. The Sysgen variable SYSGEN_WATSON_DMPGEN must be set to include the Error Report Generator in the image.
The HKEY_Local_Machine/System/ErrorReporting/DumpSettings registry key holds the registry values for error report generation. Figure 15 is a sample of such registry setting.
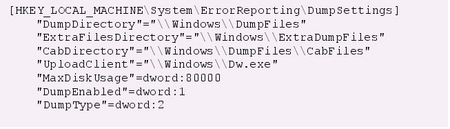
Figure 15
(Click to enlarge)
The Error Report Transfer Driver transfers registry setting values to the aforementioned reserved memory. The Error Report Generator then retrieves these settings from memory, in order to generate the appropriate dump file. These inform the Error Report Generator where to generate the dump file and what type of dump to create; in this case it's the system dump, and the maximum disk size to use is four times the size of the reserved memory.
While developing an OS design, the developer sets the type of crash dump to be generated. Each type of dump follows the same file format, three of which can be generated:
- Context dumps, 4 KB to 64 KB
- Information about the crashing system
- The exception that initiated the crash
- The context record of the faulting thread
- A module list, limited to the faulting threads of the owner process
- A thread list, limited to the faulting threads of the owner process
- The call stack of the faulting thread
- 64 bytes of memory above and below the instruction pointer of the faulting thread
- Stack memory dump of the faulting thread, truncated to fit a 64 KB limit
- System dumps, 64 KB -- several MB
- All information in a Context dump
- Calls tacks and context records for all threads
- Complete module, process, and thread lists for the entire device
- 2048 bytes of memory above and below the instruction pointer of the faulting thread.
- Global variables for the process that was current at the time of the crash
- Complete dumps, including all physical memory plus at least 64 KB
- All information in a context dump
- A complete dump of all used memory
The Error Report Generator generates files in a well-defined format. It starts with a single MINIDUMP_HEADER structure, followed by a number of MINIDUMP_DIRECTORY entries each describing data type, such as system info or exception info, the size of the data in bytes to be stored in the file, and a Relative (to the beginning of the file) Virtual Address (RVA) pointer to where the data begins in the file.
All the relevant structures can be found in $(_COMMONOAKROOT)/INC/DwCeDump.h.
Error Report Transfer Driver
The Error Report Transfer Driver moves the registry values (needed by the Error Report Generator) from the registry to the reserved memory block, and moves the generated files from reserved memory into persistent files.
After transferring a dump file to persistent storage, the Error Report Transfer Driver launches the Report Upload Client specified in the registry.
The Sysgen variable "SYSGEN_WATSON_XFER" must be set to include the Error Report Transfer Driver in the image.
The HKEY_LOCAL_MACHINE/Drivers/BuiltIn/ErrorReporting registry key holds the registry values for Error Report Transfer Driver. Figure 16 shows a sample of such a registry setting, in which the time interval for transfer polling is set to 5 minutes and the poll priority is set to 249.

Figure 16
(Click to enlarge)
Error Report Control Panel
The Error Reporting Control Panel allows the user of a display-based device to configure options for dump file generation by way of a Control Panel applet. The options available to the user are:
- Enable/disable error reporting -- on a display-based device, error reporting is enabled by default. On a headless device, error reporting is disabled by default.
- Control the amount of storage space allocated for dump files -- the control panel dialog box contains a set of radio buttons that allow the user to select the amount of storage space for storing dump files, as can be seen in Figure 17.
- Enable user notification dialogs

Figure 17
(Click to enlarge)
The Sysgen variable "SYSGEN_WATSON_CTLPNL" must be set to include the Error Reporting Control Panel in the image.
The registry settings contained in the HKLM/System/ErrorReporting/DumpSettings registry key and in theHKLM/System/ErrorReporting/UploadSettings registry key are used by the Error Reporting Control Panel to set the initial values in the control panel dialog.
Report Upload Client
The upload client is responsible for uploading the generated and created dump file to thewatson.microsoft.com error reporting web site. It is, however, possible to upload this file to another web site -- but that involves code changes, for example the function FValidBucketResponseURL, so it validates a different website than the above mentioned and implemented in (_PUBLICROOT) /WCESHELLFE/OAK/WATSON/DWUI/ DWUIDLGS.CPP.
Another file you want to look at is (_PUBLICROOT) /COMMON/OAK/INC/DWPUBLIC.H. Here, you can define a valid response server (VALID_RESPONSE_SERVER) for your server, and, of course, you need to create an upload website capable getting bucket parameters, grouping minidumps into buckets, and responding to the upload client. While all this is possible, it might not be worth the trouble.
Minidumps and Buckets
A minidump is a dump file generated on the device by Dr. Watson, containing the most important parts of a crashed application. It's "mini" name results from the fact that it contains only what is needed to identify and analyze the crashed application. A bucket represents a unique bug or problem and identifies the component responsible for the bug. Bucketing helps the upload server to organize uploaded minidumps. All of this means that minidumps describing the same problem are grouped together in what is termed a bucket.
The structure DMPFILEINFO contains all the information needed to group a minidump file in a bucket:
// Structure to contain information regarding the dump filetypedef struct tagDMPFILEINFO{ WORD wBucketParams; // how many bucket parameters are being used LPWSTR rgwzBucketParams[MAX_BUCKETPARAMS]; // bucket parameters for generic // mode LPWSTR pwzQueryString; // additional query string LPWSTR pwzAppName; // Name to display in the UI. LPWSTR pwzFilesToKeep; // files to include in log but not delete LPWSTR pwzFilesToDelete; // files to include in log but delete when finished BOOL fGenericParams; // True indicates the bucket parameters are generic // parameters} DMPFILEINFO, *PDMPFILEINFO;Figure 18
How does it work?
When an application crashes, Dr. Watson goes into action and calls a function GenerateDumpFileContentimplemented in (_WINCEROOT) PRIVATE/WINCEOS/UTILS/USREXCEPTDMP/UDUMPGEN.CPP.
This function does most of the work. It makes sure Dr. Watson is not preempted, and completes its job by setting its thread to the highest priority and its quantum to run to completion. It then gathers system, module, exception, process, and thread information into a CRASH_DATA structure defined in the same file. This structure actually defines a collection of structures. Once crash data has been collected, it resets the thread to its original state and writes the crash data to a dump file. That's it.
Epilogue
This article is by no means a comprehensive view on the subject of post mortem debugging and error reporting of retail devices. However, it should be viewed as a teaser for the reader to delve into the subject and take a look at the sources available. The following locations are a good place to begin:
- (_PUBLICROOT) /WCESHELLFE/OAK/WATSON/DWUI
- (_WINCEROOT) PRIVATE/WINCEOS/COREOS/NK/OSAXS
- (_WINCEROOT) PRIVATE/WINCEOS/UTILS/USREXCEPTDMP
We hope that error reporting will become part of the retail images you create, mainly so you can provide better and more robust systems for your clients.
- Finding Windows CE bugs with help from "Dr. Watson"
- Finding Windows CE bugs with help from "Dr. Watson"
- Finding Windows CE bugs with help from "Dr. Watson"
- Windows程序调试--Dr.Watson调试
- Dr.Watson
- Windows自带的小巧的调试利器--Dr.Watson
- Windows自带的小巧的调试利器--Dr.Watson
- 如何禁用或启用 Windows 的 Dr. Watson
- Windows自带的小巧的调试利器--Dr.Watson
- Dr.Watson使用心得
- Dr.Watson详解
- Dr.Watson使用技巧摘要
- Dr.Watson使用技巧摘要
- Windows CE: Finding the cause of a Data Abort
- 软件测试之Dr.Watson篇
- 关闭Dr.Watson方法2种
- 禁止drwtsn32.exe(Dr.Watson)运行
- Reading a Dr. Watson Log File
- git多人协作开发流程(以blog为例)
- uva 10688 - The Poor Giant(区间dp)
- Kinect for Windows SDK开发入门(十四):进阶指引 上
- U盘引导安装Solaris11_x86_64
- hdu 4715Difference Between Primes
- Finding Windows CE bugs with help from "Dr. Watson"
- Mysql错误总结
- Kinect for Windows SDK开发入门(十五):进阶指引
- 林彪总结当好师长的“九条经验”
- [HDU 3336]Count the String[kmp][DP]
- 获取当前系统时间
- 在hadoop集群上运行mapreduce程序时报错“org.apache.hadoop.util.Shell$ExitCodeException:***not found”
- js中try/catch/throw的用法
- Java中常见的几种异常