Data Mining Week2 - L1
来源:互联网 发布:企业网络营销策划报告 编辑:程序博客网 时间:2024/05/07 19:06
Data Mining is really demanding for me...
This week the TA held the lecture. I am not going to bitch too much about him, but just organize the notes myself.
outline
–Naïve Bayesian Classifier
• Ignores correlations between inputs, can handle very highly dimensional data, can use various types of density models (including nonparametric)
–Logistic Regression
• Designed for binary classification, typically produceslinear decision boundaries, less effective if data distributions are not linearly separable, can leverage correlations between inputs in multivariate problems
–SVM
• Can produce models that are more robust than Logistic Regression, nonlinear kernel transformations can help dealing with some nonlinearities indata, can be computationally expensive
–k-NN
• Nonparametric, effective when data is not easily (e.g. linearly) separable, less reliable in highly dimensional problems
• How to determine the shape of a decision boundary from the parameters of a logistic regression model
• Different variants of k-NN approaches to classification
• Usefulness of a classifier’s ability to refuse making a prediction
• How to use k-NN in regression
Meanwhile I found so much useful materials on line for Logistic regression: (O yeah, it has nothing to do with logistics)
Classification
Generative methods: Bayes’ classifiers(贝叶斯分类器的分类原理是通过某对象的先验概率,利用贝叶斯公式计算出其后验概率,即该对象属于某一类的概率,选择具有最大后验概率的类作为该对象所属的类)(help)
Discriminative methods (linear, non-linear): Logistic Regression, Support Vector Machines (SVMs), Fisher’s discriminants (LDA), Perceptron, many neural networks, ...
Non-parametric classifiers (a.k.a. instance-based, casebased):nearest-neighbor
Logistic Regression:
Logistic regression measures the relationship between a categorical dependent variable and one or more independent variables, which are usually (but not necessarily) continuous, by using probability scores as the predicted values of the dependent variable.
(really basic help0 for super confused me)逻辑回归是产生一个0~1可能性的线性回归
该数值并不是数学中定义的概率值,数值具备可比性和可加合性。这是用logistic回归而非直接线性回归的主要原因。
Logistic Regression 就是一个被logistic方程归一化后的线性回归,适合于分类问题。
可用于概率预测,也可用于分类。
仅能用于线性问题
不需要满足条件独立假设
(help1)
Suppose we want to predict whether someone is male or female (DV, M=1, F=0) using height in inches (IV). We could plot the relations between the two variables as we customarily do in regression. The plot might look something like this:

Points to notice about the graph (data are fictional):
- The regression line is a rolling average, just as in linear regression. The Y-axis is P, which indicates the proportion of 1s at any given value of height. (review graph)
- The regression line is nonlinear. (review graph)
- None of the observations --the raw data points-- actually fall on the regression line. They all fall on zero or one. (review graph)
The logistic curve relates the independent variable, X, to the rolling mean of the DV, P (![]() ).
).

where P is the probability of a 1 (the proportion of 1s, the mean of Y), e is the base of the natural logarithm (about 2.718) and a and b are the parameters of the model.
The value of a yields P when X is zero, and b(defines slope of the logistic curve) adjusts how quickly the probability changes with changing X a single unit (we can have standardized and unstandardized b weights in logistic regression, just as in ordinary linear regression). Because the relation between X and P is nonlinear, b does not have a straightforward interpretation in this model as it does in ordinary linear regression.
This curve is derived from odds: 赔率而非概率
 .
.
In logistic regression, the dependent variable is a logit, which is the natural log of the odds, that is,

Of course, people like to talk about probabilities more than odds. To get there (from logits to probabilities), we first have to take the log out of both sides of the equation. Then we have to convert odds to a simple probability:
 If log odds are linearly related to X, then the relation between X and P is nonlinear, and has the form of the S-shaped curve graph.
如果赔率和X是线性相关,则概率P和X就是以上的S曲线
(help from CMU : TO READ LATER)
Back to lecture:
It scales up easily to higher dimensionality of the input space. e的指数变成a+bX1+cX2
A crispclassification threshold corresponds to p(x)=0.5 , for a 2D, p(x1,x2)=0.5
Using logistic regression when the number of available input features is large
Three conceivable approaches:
1.Build one joint multivariate logistic regression model using all features
• Computationally (relatively) inexpensive 相对好计算
• Vulnerable to redundancies between features 容易被f之间的冗余影响
• Vulnerable to over-fitting (if we are looking at many features) 容易过分fit
2.Build M independent uni-variate logistic regression models and multiply resulting univariate predictions to obtain joint result
• More expensive, but still affordable 还能计算
• More robust to over-fitting 不太容易过fit
• Acts like Naïve Bayes’: Ignores correlations between features 忽略了f之间的相关性
3.Perform step-wise logistic regression and select the best single feature, then the best pair of features including the individual best, then the best triple including the best pair, and so on, gradually increasing complexity of the model
• Quite expensive, but robust + it tackles redundancies
--------------------------------------------------------------------------------以上全部都是线性分类器------------------------------这是线样子的分割线-----------------------------------------------------------
Support Vector Machines: SVMs (help)
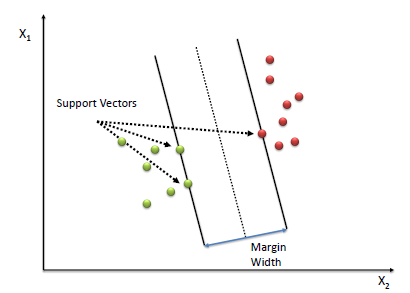
• Choose the line with the maximum margin
• Result is a "robust" classifier
• Can be solved efficiently with a quadratic program(二次规划是非线性规划中的一类特殊数学规划问题)
For not linearly separable data(无法一条线分开的数据)
• Update the quadratic program to include a penalty function for misclassifications
• Use a kernel function to project the data into a higher dimensional space 变成高次方数比如X平方
• A kernel function creates a nonlinear boundary in the original feature space (but it is still linear in the kernel space)
Challenge
data is very noisy or significantly overlap
the distribution of data does not allow for obvious separability
“Nearest Neighbor” classifier
Measure distances between the query point and all available data points and then assign the query to the class of its closest neighbor
Pro:
• Simple algorithm
• Non-parametric
• Reasonably accurate
• The neighbors are useful for justifying predictions
Con:
• Costly for large data sets – Smart data structures remedy this
• Distances can break down in high dimensions – 5-7 is as far as we would usually go,
unless there is a large supply of data
from which to train
• Some over-fitting potential:
k closest neighbors减轻这个问题
Majority vote VS Weighted voting
Constraining distance VS Unconstrained kernels
- Data Mining Week2 - L1
- Data Mining Week2 - L2 ROC方法二元分
- Data Mining
- Data Mining
- Data Mining
- Data Mining
- DATA MINING
- text mining and analytics学习笔记week2
- DATA MINING(1) Data mining introduction
- What is Data Mining?
- DATA MINING 过程
- Data Mining Trends
- Data Mining资源大全
- Data Mining资源大全
- 何谓Data Mining
- Data Mining 的功能
- 数据挖掘(Data Mining)
- Mining Graph Data
- 绝对定位实现div重叠
- Java数据类型和MySql数据类型对应表
- 细说Servlet 会话技术介绍
- 关于有无符号数
- 细说Servlet Cookie
- Data Mining Week2 - L1
- 洒出
- LeetCode题解:Permutations I and II
- The first time to exercise the convolution
- 细说Servlet 保存会话的技术 Session
- Ubuntu 12.04 安装VMware Player 6.0
- Sublime Text 2.02注册码
- centos关机与重启命令详解
- Data Mining Week2 - L2 ROC方法二元分