无锁编程入门
来源:互联网 发布:视频php服务器配置 编辑:程序博客网 时间:2024/04/29 05:39
_InterlockedIncrement OSAtomicAdd32 std::atomic::fetch_add std::atomic<>::is_lock_free来确认下。不同的CPU系列支持RMW的方式不同。PowerPC _InterlockedCompareExchange。通常,程序员在一个循环中执行CAS,反复尝试执行某一个事务。这种模式通常会把一个共享的变量拷贝为临时变量,执行一些操作,并尝试使用CAS把修改后的共享变量设置回去。 {
}
- Anthony Williams’ blog
and his book, C++ Concurrency in Action - Dmitriy V’jukov’s website
and various forum discussions - Bartosz Milewski’s blog
- Charles Bloom’s
Low-Level Threading series on his blog - Doug Lea’s
JSR-133 Cookbook - Howells and McKenney’s
memory-barriers.txt document - Hans Boehm’s
collection of links about the C++11 memory model - Herb Sutter’s
Effective Concurrency series
Lightweight In-Memory Logging
When debugging multithreaded code, it’s not always easy to determine which codepath was taken. You can’t always reproduce the bug while stepping through the debugger, nor can you always sprinkleprintfs throughout the code, as you might in a single-threaded program. There might be millions of events before the bug occurs, andprintf can easily slow the application to a crawl, mask the bug, or create a spam fest in the output log.
One way of attacking such problems is to instrument the code so that events are logged to a circular buffer in memory. This is similar to addingprintfs, except that only the most recent events are kept in the log, and the performance overhead can be made very low using lock-free techniques.
Here’s one possible implementation. I’ve written it specifically for Windows in 32-bit C++, but you could easily adapt the idea to other platforms. The header file contains the following:
#include <windows.h>#include <intrin.h>namespace Logger{ struct Event { DWORD tid; // Thread ID const char* msg; // Message string DWORD param; // A parameter which can mean anything you want }; static const int BUFFER_SIZE = 65536; // Must be a power of 2 extern Event g_events[BUFFER_SIZE]; extern LONG g_pos; inline void Log(const char* msg, DWORD param) { // Get next event index LONG index = _InterlockedIncrement(&g_pos); // Write an event at this index Event* e = g_events + (index & (BUFFER_SIZE - 1)); // Wrap to buffer size e->tid = ((DWORD*) __readfsdword(24))[9]; // Get thread ID e->msg = msg; e->param = param; }}#define LOG(m, p) Logger::Log(m, p)
And you must place the following in a .cpp file.
namespace Logger{ Event g_events[BUFFER_SIZE]; LONG g_pos = -1;}
This is perhaps one of the simplest examples of lock-free programming which actually does something useful. There’s a single macroLOG, which writes to the log. It uses _InterlockedIncrement, an atomic operation which I’ve talked about inprevious posts, for thread safety. There are no readers. You are meant to be the reader when you inspect the process in the debugger, such as when the program crashes, or when the bug is otherwise caught.
Using It to Debug My Previous Post
My previous post, Memory Reordering Caught In the Act, contains a sample program which demonstrates a specific type of memory reordering. There are two semaphores,beginSema1 and beginSema2, which are used to repeatedly kick off two worker threads.
While I was preparing the post, there was only a single beginSema shared by both threads. To verify that the experiment was valid, I added a makeshift assert to the worker threads. Here’s the Win32 version:
DWORD WINAPI thread1Func(LPVOID param){ MersenneTwister random(1); for (;;) { WaitForSingleObject(beginSema, INFINITE); // Wait for signal while (random.integer() % 8 != 0) {} // Random delay // ----- THE TRANSACTION! ----- if (X != 0) DebugBreak(); // Makeshift assert X = 1; _ReadWriteBarrier(); // Prevent compiler reordering only r1 = Y; ReleaseSemaphore(endSema, 1, NULL); // Notify transaction complete } return 0; // Never returns};Surprisingly, this “assert” got hit, which means that X was not 0 at the start of the experiment, as expected. This puzzled me, sinceas I explained in that post, the semaphores are supposed to guarantee the initial valuesX = 0 and Y = 0 are completely propogated at this point.
I needed more visibility on what was going on, so I added the LOG macro in a few strategic places. Note that the integer parameter can be used to log any value you want. In the secondLOG statement below, I use it to log the initial value of X. Similar changes were made in the other worker thread.
for (;;) { LOG("wait", 0); WaitForSingleObject(beginSema, INFINITE); // Wait for signal while (random.integer() % 8 != 0) {} // Random delay // ----- THE TRANSACTION! ----- LOG("X ==", X); if (X != 0) DebugBreak(); // Makeshift assert X = 1; _ReadWriteBarrier(); // Prevent compiler reordering only r1 = Y; ReleaseSemaphore(endSema, 1, NULL); // Notify transaction complete }
And in the main thread:
for (int iterations = 1; ; iterations++) { // Reset X and Y LOG("reset vars", 0); X = 0; Y = 0; // Signal both threads ReleaseSemaphore(beginSema, 1, NULL); ReleaseSemaphore(beginSema, 1, NULL); // Wait for both threads WaitForSingleObject(endSema, INFINITE); WaitForSingleObject(endSema, INFINITE); // Check if there was a simultaneous reorder LOG("check vars", 0); if (r1 == 0 && r2 == 0) { detected++; printf("%d reorders detected after %d iterations\n", detected, iterations); } }
The next time the “assert” was hit, I checked the contents of the log simply by watching the expressionsLogger::g_pos and Logger::g_events in the Watch window.
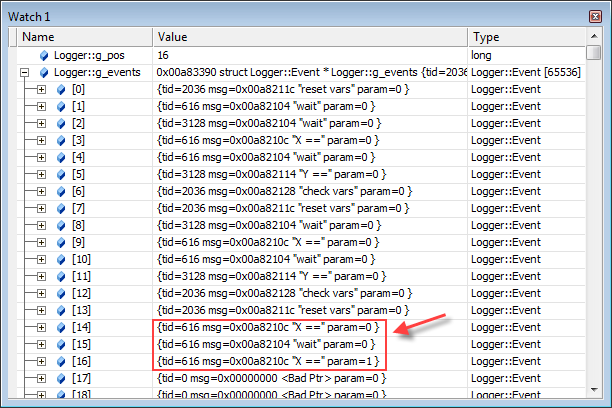
In this case, the assert was hit fairly quickly. Only 17 events were logged in total (0 - 16). The final three events made the problem obvious: a single worker thread had managed to iteratetwice before the other thread got a chance to run. In other words, thread1 had stolen the extra semaphore count which was intended to kick off thread2! Splitting this semaphore into two separate semaphores fixed the bug.
This example was relatively simple, involving a small number of events. In some games I’ve worked on, we’ve used this kind of technique to track down more complex problems. It’s still possible for this technique to mask a bug; for example, whenmemory reordering is the issue. But even if so, that may tell you something about the problem.
Tips on Viewing the Log
The g_events array is only big enough to hold the latest 65536 events. You can adjust this number to your liking, but at some point, the index counterg_pos will have to wrap around. For example, if g_pos has reached a value of 3630838, you can find the last log entry by taking this value modulo 65536. Using interactive Python:
>>> 3630838 % 6553626358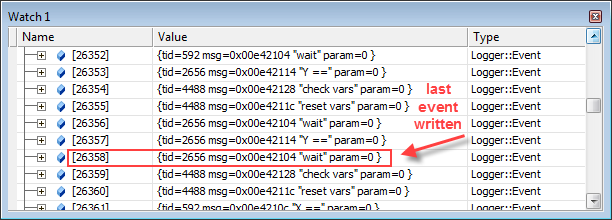
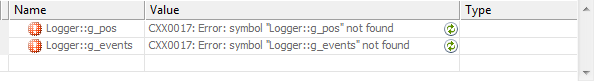
When breaking, you may also find that “CXX0017: Error: symbol not found” is sometimes shown in the Watch window, as seen here:
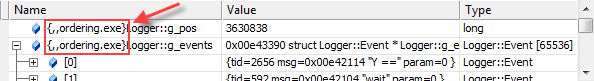
This usually means that the debugger’s current thread and stack frame context is inside an external DLL instead of your executable. You can often fix it by double-clicking a different stack frame in the Call Stack window and/or a different thread in the Threads window. If all else fails, you can always add the context operator to your Watch expression, explicitly telling the debugger which module to use to resolve these symbols:
One convenient detail about this implementation is that the event log is stored in a global array. This allows the log show up in crash dumps, via an automated crash reporting system for example, even when limitedminidump flags are used.
What Makes This Lightweight?
In this implementation, I strived to make the LOG macro as non-intrusive as reasonably possible. Besides being lock-free, this is mainly achieved through copious use of compiler intrinsics, which avoid the overhead of DLL function calls for certain functions. For example, instead of calling InterlockedIncrement, which involves a call into kernel32.dll, I used the intrinsic function_InterlockedIncrement (with an underscore).
Similarly, instead of getting the current thread ID from GetCurrentThreadId, I used the compiler intrinsic __readfsdword to read the thread ID directly from the Thread Information Block (TIB), an undocumented but well-known data structure in Win32.
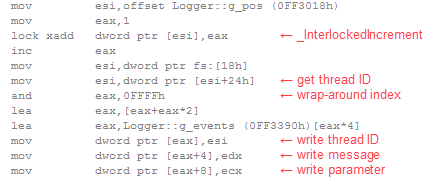
You may question whether such micro-optimizations are justified. However, after building several makeshift logging systems, usually to handle millions of events in high-performance, multi-threaded code, I’ve come to believe that the less intrusive you can make it, the better. As a result of these micro-optimizations, the LOG macro compiles down to a few machine instructions, all inlined, with no function calls, no branching and no blocking:
This technique is attractive because it is very easy to integrate. There are many ways you could adapt it, depending on your needs, especially if performance is less of a concern. You could add timestamps and stack traces. You could introduce a dedicated thread to spool the event log to disk, though this would require much more sophisticated synchronization than the single atomic operation used here.
After adding such features, the technique would begin to resemble Microsoft’s Event Tracing for Windows (ETW) framework, so if you’re willing to go that far, it might be interesting to look at ETW’ssupport for user-mode provider events instead.
- 无锁编程入门
- 无锁编程入门
- 无锁队列入门
- 无锁编程
- 无锁编程介绍
- Linux无锁编程
- 无锁编程
- 无锁编程 汇总
- 多线程无锁编程
- 无锁编程介绍
- 无锁编程实例
- linux无锁编程
- Linux无锁编程
- 无锁编程 - 大纲
- 无锁编程
- 无锁编程
- Linux无锁编程
- 无锁的并发编程
- netlink简单实例
- open的O_DIRECT选项
- 使用MVC结构计算梯形面积
- 友好城市
- 网易博客#include<cstdio>转载
- 无锁编程入门
- CSS3+HTML5学习笔记四--CSS三栏布局-宽度只适应
- html display
- 看JSlider的jdk源码学观察者模式
- 我所理解的生活
- Positive Semi-definite matrix
- Android数据库 之 SQLite数据库(创建与使用)
- Linux 后台服务进程的开发
- 临时对象与返回值优化