JFreeChart柱状图单组柱子的不同颜色显示
来源:互联网 发布:生死狙击改枪软件 编辑:程序博客网 时间:2024/04/28 07:55
JFreeChart柱状图中单组柱子用不同颜色来显示的实现方法是自定义一个Renderer来继承BarRenderer类,然后重载getItemPaint(int i,int j)方法。
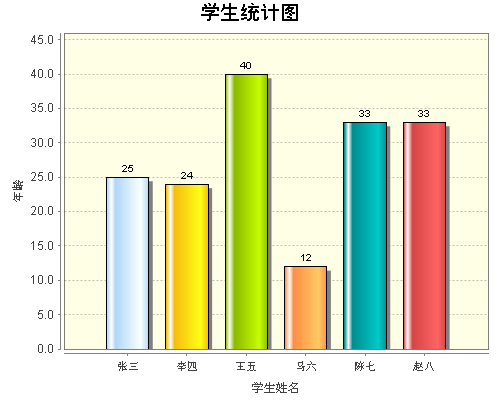
实现效果如下:
实现代码如下:
- public class CustomRenderer extends org.jfree.chart.renderer.category.BarRenderer {
- /**
- *
- */
- private static final long serialVersionUID = 784630226449158436L;
- private Paint[] colors;
- //初始化柱子颜色
- private String[] colorValues = { "#AFD8F8", "#F6BD0F", "#8BBA00", "#FF8E46", "#008E8E", "#D64646" };
- public CustomRenderer() {
- colors = new Paint[colorValues.length];
- for (int i = 0; i < colorValues.length; i++) {
- colors[i] = Color.decode(colorValues[i]);
- }
- }
- //每根柱子以初始化的颜色不断轮循
- public Paint getItemPaint(int i, int j) {
- return colors[j % colors.length];
- }
- }
- public class CreateJFreeChartBarColor {
- /**
- * 创建JFreeChart Bar Chart(柱状图)
- */
- public static void main(String[] args) {
- // 步骤1:创建CategoryDataset对象(准备数据)
- CategoryDataset dataset = createDataset();
- // 步骤2:根据Dataset 生成JFreeChart对象,以及做相应的设置
- JFreeChart freeChart = createChart(dataset);
- // 步骤3:将JFreeChart对象输出到文件,Servlet输出流等
- saveAsFile(freeChart, "E:\\bar.png", 500, 400);
- }
- // 保存为文件
- public static void saveAsFile(JFreeChart chart, String outputPath, int weight, int height) {
- FileOutputStream out = null;
- try {
- File outFile = new File(outputPath);
- if (!outFile.getParentFile().exists()) {
- outFile.getParentFile().mkdirs();
- }
- out = new FileOutputStream(outputPath);
- // 保存为PNG文件
- ChartUtilities.writeChartAsPNG(out, chart, weight, height);
- out.flush();
- } catch (FileNotFoundException e) {
- e.printStackTrace();
- } catch (IOException e) {
- e.printStackTrace();
- } finally {
- if (out != null) {
- try {
- out.close();
- } catch (IOException e) {
- // do nothing
- }
- }
- }
- }
- // 根据CategoryDataset生成JFreeChart对象
- public static JFreeChart createChart(CategoryDataset categoryDataset) {
- JFreeChart jfreechart = ChartFactory.createBarChart("学生统计图", // 标题
- "学生姓名", // categoryAxisLabel (category轴,横轴,X轴的标签)
- "年龄", // valueAxisLabel(value轴,纵轴,Y轴的标签)
- categoryDataset, // dataset
- PlotOrientation.VERTICAL, false, // legend
- false, // tooltips
- false); // URLs
- Font labelFont = new Font("SansSerif", Font.TRUETYPE_FONT, 12);
- jfreechart.setTextAntiAlias(false);
- jfreechart.setBackgroundPaint(Color.white);
- CategoryPlot plot = jfreechart.getCategoryPlot();// 获得图表区域对象
- // 设置横虚线可见
- plot.setRangeGridlinesVisible(true);
- // 虚线色彩
- plot.setRangeGridlinePaint(Color.gray);
- // 数据轴精度
- NumberAxis vn = (NumberAxis) plot.getRangeAxis();
- // vn.setAutoRangeIncludesZero(true);
- DecimalFormat df = new DecimalFormat("#0.0");
- vn.setNumberFormatOverride(df); // 数据轴数据标签的显示格式
- // x轴设置
- CategoryAxis domainAxis = plot.getDomainAxis();
- domainAxis.setLabelFont(labelFont);// 轴标题
- domainAxis.setTickLabelFont(labelFont);// 轴数值
- // Lable(Math.PI/3.0)度倾斜
- // domainAxis.setCategoryLabelPositions(CategoryLabelPositions
- // .createUpRotationLabelPositions(Math.PI / 3.0));
- domainAxis.setMaximumCategoryLabelWidthRatio(6.00f);// 横轴上的 Lable
- // 是否完整显示
- // 设置距离图片左端距离
- domainAxis.setLowerMargin(0.1);
- // 设置距离图片右端距离
- domainAxis.setUpperMargin(0.1);
- // 设置 columnKey 是否间隔显示
- // domainAxis.setSkipCategoryLabelsToFit(true);
- plot.setDomainAxis(domainAxis);
- // 设置柱图背景色(注意,系统取色的时候要使用16位的模式来查看颜色编码,这样比较准确)
- plot.setBackgroundPaint(new Color(255, 255, 204));
- // y轴设置
- ValueAxis rangeAxis = plot.getRangeAxis();
- rangeAxis.setLabelFont(labelFont);
- rangeAxis.setTickLabelFont(labelFont);
- // 设置最高的一个 Item 与图片顶端的距离
- rangeAxis.setUpperMargin(0.15);
- // 设置最低的一个 Item 与图片底端的距离
- rangeAxis.setLowerMargin(0.15);
- plot.setRangeAxis(rangeAxis);
- // 解决中文乱码问题(关键)
- TextTitle textTitle = jfreechart.getTitle();
- textTitle.setFont(new Font("黑体", Font.PLAIN, 20));
- domainAxis.setTickLabelFont(new Font("sans-serif", Font.PLAIN, 11));
- domainAxis.setLabelFont(new Font("宋体", Font.PLAIN, 12));
- vn.setTickLabelFont(new Font("sans-serif", Font.PLAIN, 12));
- vn.setLabelFont(new Font("黑体", Font.PLAIN, 12));
- // jfreechart.getLegend().setItemFont(new Font("宋体", Font.PLAIN, 12));
- // 使用自定义的渲染器
- CustomRenderer renderer = new CustomRenderer();
- // 设置柱子宽度
- renderer.setMaximumBarWidth(0.2);
- // 设置柱子高度
- renderer.setMinimumBarLength(0.2);
- // 设置柱子边框颜色
- renderer.setBaseOutlinePaint(Color.BLACK);
- // 设置柱子边框可见
- renderer.setDrawBarOutline(true);
- // 设置每个地区所包含的平行柱的之间距离
- renderer.setItemMargin(0.5);
- jfreechart.getRenderingHints().put(RenderingHints.KEY_TEXT_ANTIALIASING, RenderingHints.VALUE_TEXT_ANTIALIAS_OFF);
- // 显示每个柱的数值,并修改该数值的字体属性
- renderer.setIncludeBaseInRange(true);
- renderer.setBaseItemLabelGenerator(new StandardCategoryItemLabelGenerator());
- renderer.setBaseItemLabelsVisible(true);
- plot.setRenderer(renderer);
- // 设置柱的透明度
- plot.setForegroundAlpha(1.0f);
- // 背景色 透明度
- plot.setBackgroundAlpha(0.5f);
- return jfreechart;
- }
- // 创建CategoryDataset对象
- public static CategoryDataset createDataset() {
- double[][] data = new double[][] { { 25, 24, 40, 12, 33, 33 } };
- String[] rowKeys = { "" };
- String[] columnKeys = { "张三", "李四", "王五", "马六", "陈七", "赵八" };
- CategoryDataset dataset = DatasetUtilities.createCategoryDataset(rowKeys, columnKeys, data);
- return dataset;
- }
- }
0 0
- JFreeChart柱状图单组柱子的不同颜色显示
- JFreeChart柱状图单组柱子的不同颜色显示
- JFreeChart柱状图单组柱子的不同颜色显示
- jfreechart 实现单组柱子不同颜色
- Echarts柱状图的每个柱子显示不同颜色问题
- (3)Jfreechart柱状图自定义柱子颜色以及柱子的方向
- 关于JFreeChart横向柱状图如何将数值显示到柱子顶端的问题
- JfreeChart实现柱状图的每根柱子颜色不同
- flex -设置柱状图ColumnChart的彩虹柱子、点击单个柱子高亮显示(三)
- JFreeChart改变柱子的宽度,柱子上显示值,图片自适应大小
- 柱状图使用实例--设置柱子上是否显示数值及数值的显示位置
- JfreeChart根据柱子实际高度显示值在柱子里面,或是在柱子外面
- 介绍一篇“让echarts柱状图的每个柱子显示不同的颜色”的好博客
- Highcharts做柱状图怎样样每个柱子都是不同的颜色显示
- 改变ireport中柱状图的柱子宽度
- echarts改变柱状图每个柱子的颜色
- 设定JFreeChart柱子上面的颜色
- jfreechart柱状图顶部显示数值?
- Linux创建、删除文件和文件夹等操作命令
- Kernel Korner - Why and How to Use Netlink Socket
- OpenGL GLSL Blocks
- JUnit的各种断言
- NMAP的格式化输出
- JFreeChart柱状图单组柱子的不同颜色显示
- JAVA单例模式的几种实现方法
- Qt下使用OpenGL(4)-根据NeHe的教程改写的
- 关闭linux的sendmail服务
- android UI绘制
- 子网掩码,默认网关,DNS服务器地址是什么
- 我和大牛的差距
- TlHelp32
- AES加密工具类