Four Linux server monitoring tools
来源:互联网 发布:最全的身份证网络理财 编辑:程序博客网 时间:2024/05/14 11:49
原文地址:http://aarvik.dk/four-linux-server-monitoring-and-management-tools/
Here is four strong monitoring tools i would like to present for you.
htop - interactive process viewer
You may know the standard tool for watching real time processes on your machine top. If not, run $ top to see it in action, and $ man top to read the manual.
The htop is a widely extended version of top, with a big overview (eg. full commands, visualization, gui and ui), a mouse-clicking interaction, and a lot of guidance on how to do process management.
Install it and try it out: $ sudo apt-get install htop
Screenshot: 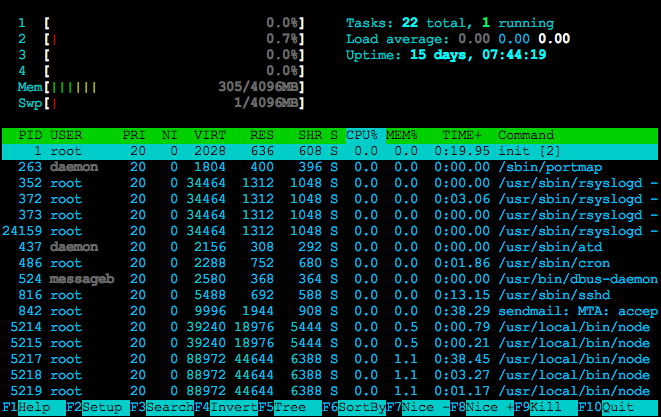
- From my OS X terminal in my Debian 7 box
iotop - simple top-like I/O monitor
Iotop is a real-time monitor for IO. It displays information about each process thread in your system with their belonging detailed input and output (IO) usage.
This can be used together with $ tcpdump which respond with network traffic. If you can see that something is going on with your web server you can eg. check your port 80 (standard http port) networks traffics by running $ tcpdump port 80 to see details.
The most useful information is probably the DISK WRITE column, where you can see exactly how much process in K/s each IO uses.
Install it and try it out: $ sudo apt-get install iotop
Screenshot: 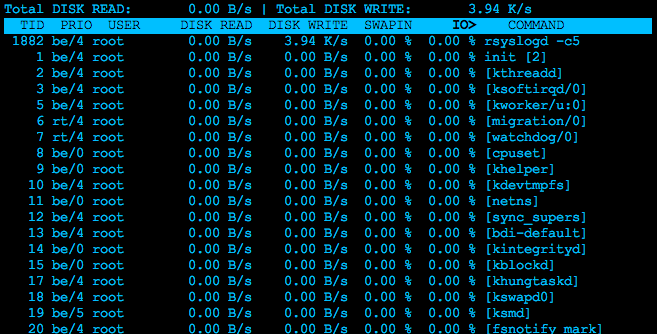
apachetop - display real-time web server statistics
Apachetop displays a realtime table with http requests to your Apache webserver.
It displays stats, hits, requests, request details, and is good to get an overview for what is happening on your web server right now.
If you use Nginx there is similar tools, but seems like they are not as detailed as apachetop.
Install it and try it out: $ sudo apt-get install apachetop
Screenshot: 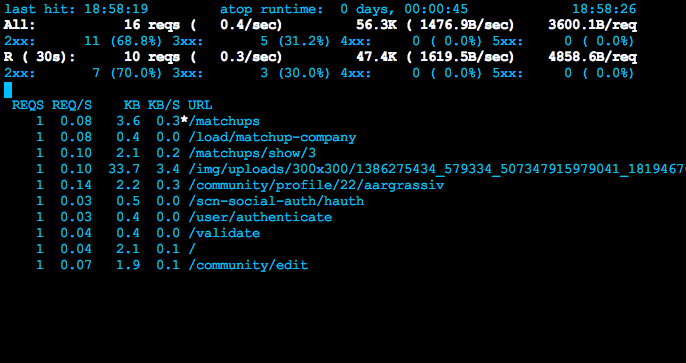
Glances - CLI curses based monitoring tool
Glances displays columns in separated tables for various useful real-time data about what is going on on your machine. Glances aims to show as much information as possible on a minimum of space, and i think it's goal is fully reached.
Glances monitor PerCPU, Load, Memory, Swap, Network, Disk i/O, Mount data and processes, with limited interaction possibilities and deep information, but is abosolutely perfect to get an big overview.
Install it and try it out: $ sudo apt-get install glances
Screenshot: 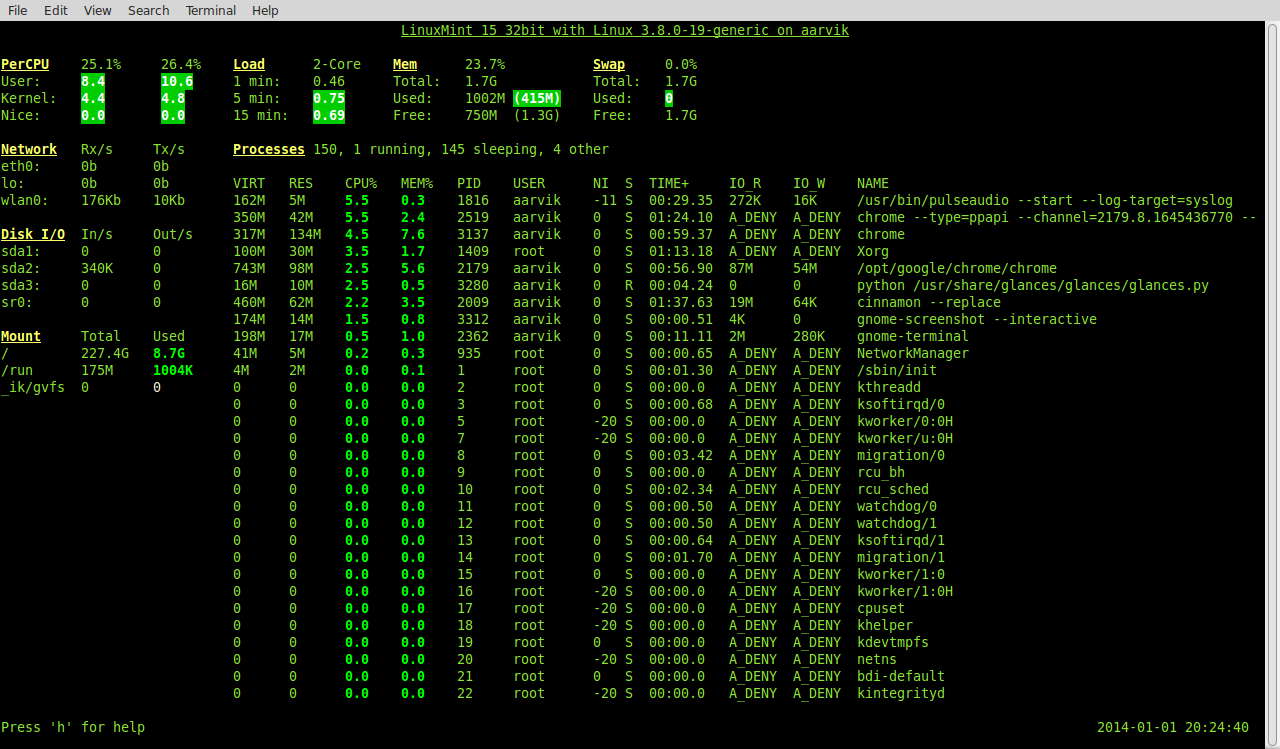
- Four Linux server monitoring tools
- Linux Server Monitoring
- Linux Server Hacks, Volume Two: Tips & Tools for Connecting, Monitoring, and Troubleshooting
- 16 Tools for Server Performance Tuning and Monitoring
- 10 Free Server & Network Monitoring Tools that Kick Ass
- 20 Linux System Monitoring Tools Every SysAdmin Should Know
- 20 Linux System Monitoring Tools Every SysAdmin Should Know
- 20 Linux System Monitoring Tools Every SysAdmin Should Know
- 6 Command Line Tools for Linux Performance Monitoring
- 20 Linux System Monitoring Tools Every SysAdmin Should Know
- Top 25 Best Linux Performance Monitoring and Debugging Tools
- 20 Linux System Monitoring Tools Every SysAdmin Should Know
- 20 Linux System Monitoring Tools Every SysAdmin Should Know
- What are good open-source log monitoring tools on Linux
- BCC – Dynamic Tracing Tools for Linux Performance Monitoring
- DB2 Aix Monitoring/alerts tools
- Monitoring and benchmark tools(1)
- Java Monitoring Tools之jcmd
- android游戏开发项目实战——数独 .
- 同学聚会
- 2014年春节到香港旅游攻略
- Linked List Cycle II
- 一个操作firebird的helper类
- Four Linux server monitoring tools
- 孙子兵法
- 茶如人生 淡雅一世
- 拾荒夫妇捡6斤1两黄金还失主 相当于其40年收入
- MSSQL数据库转到FIREBIRD数据库的问题
- 男子2年5次遗弃亲生儿子 称再送回来就杀死
- Java容器集合类
- 图片浏览器学习之一
- 林志玲“女神导航”,高德如何用够明星价值?