使用C#和Excel进行报表开发(三)-生成统计图(Chart)
来源:互联网 发布:2017欢乐豆刷豆软件 编辑:程序博客网 时间:2024/05/16 08:07
有的Web项目选用Excel作为报表方案,在服务器端生成Excel文件,然后传送到客户端,由客户端进行打印。在国内的环境下,相对PDF方式,Excel的安装率应该比pdf阅读器的安装率要高,同时,微软也为C#操作Excel提供了完备的接口,虽然ZedGraph和其他的商业报表工具生成的统计图也很好,但是人家微软毕竟是大品牌,值得信赖。
本文介绍使用C#调用Excel来生成统计图(Chart)的以及Chart图中各部分控制的一些方法。
在上一篇使用C#和Excel进行报表开发(二)-操作统计图(Chart)中,我们使用一个预定义的Excel文件,通过改变Chart中的某个值来生成统计图。本文进一步演示如何从指定的数据从头生成统计图。
首先当然要添加对Excel的引用,然后需要定义几个要用到的Excel对象:
Excel.Application ThisApplication = null;
Excel.Workbooks m_objBooks = null;
Excel._Workbook ThisWorkbook = null;
Excel.Worksheet xlSheet = null;
在创建一个新的_WorkBook对象的时候,默认的会含有3个Sheet,所以为了显示清晰,将多余的Sheet都删掉:
private void DeleteSheet()
{
foreach (Excel.Worksheet ws in ThisWorkbook.Worksheets)
if (ws != ThisApplication.ActiveSheet)
{
ws.Delete();
}
foreach (Excel.Chart cht in ThisWorkbook.Charts)
cht.Delete();
}
再下来需要添加用来给Chart提供数据的Sheet:
private void AddDatasheet()
{
xlSheet = (Excel.Worksheet)ThisWorkbook.
Worksheets.Add(Type.Missing, ThisWorkbook.ActiveSheet,
Type.Missing, Type.Missing);
xlSheet.Name = "数据";
}
生成Chart用到的数据,因为是演示,所以这里使用生成随机数的方法来替代从数据库中提取数据。
private void LoadData()
{
Random ran = new Random();
for (int i = 1; i <= 12; i++)
{
xlSheet.Cells[i, 1] = i.ToString() + "月";
xlSheet.Cells[i, 2] = ran.Next(2000).ToString();
}
}
好了,到此,准备工作全部已经就绪,下面要进行Chart的生成设置部分了:
生成一个统计图对象:
Excel.Chart xlChart = (Excel.Chart)ThisWorkbook.Charts.
Add(Type.Missing, xlSheet, Type.Missing, Type.Missing);
设定数据来源:
Excel.Range cellRange = (Excel.Range)xlSheet.Cells[1, 1];
通过向导生成Chart:
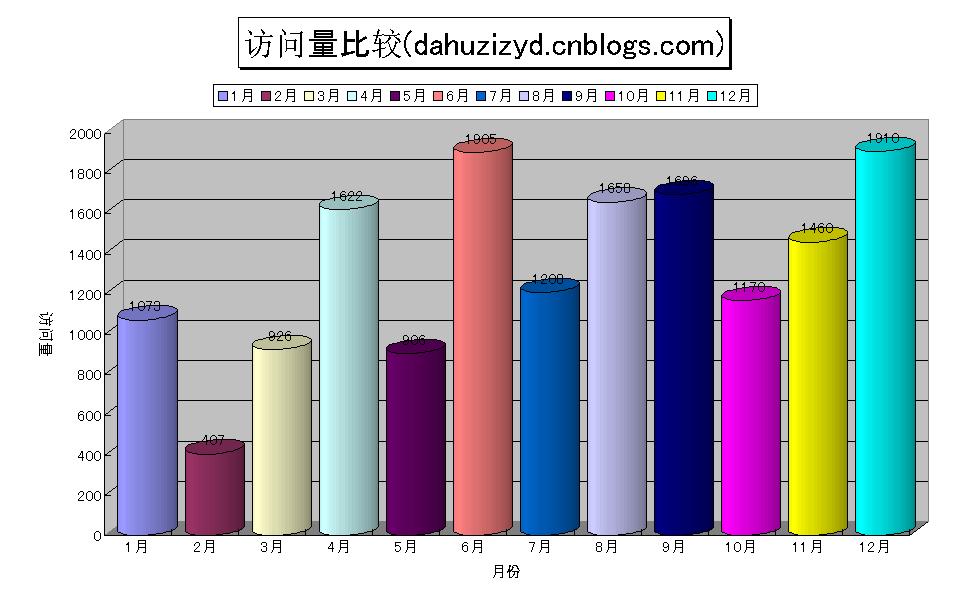
xlChart.ChartWizard(cellRange.CurrentRegion,
Excel.XlChartType.xl3DColumn, Type.Missing,
Excel.XlRowCol.xlColumns,1, 0, true ,
"访问量比较(dahuzizyd.cnblogs.com)", "月份", "访问量",
"");
到此,Chart的生成就完成了,貌似比较简单,下面我们对其作一些设置,好更漂亮些。
设置统计图Sheet的名称:
xlChart.Name = "统计";
现在的统计图只有一个组,他们会显示成一样的颜色,我们来让12个Bar都显示不同的颜色:
Excel.ChartGroup grp = (Excel.ChartGroup)xlChart.ChartGroups(1);
grp.GapWidth = 20;
grp.VaryByCategories = true;
现在Chart的条目的显示形状是Box,我们让它们变成圆柱形,并给它们显示加上数据标签:
Excel.Series s = (Excel.Series)grp.SeriesCollection(1);
s.BarShape = XlBarShape.xlCylinder;
s.HasDataLabels = true;
下面再来设置统计图的标题和图例的显示:
xlChart.Legend.Position = XlLegendPosition.xlLegendPositionTop;
xlChart.ChartTitle.Font.Size = 24;
xlChart.ChartTitle.Shadow = true;
xlChart.ChartTitle.Border.LineStyle = Excel.XlLineStyle.xlContinuous;
最后设置两个轴的属性,Excel.XlAxisType.xlValue对应的是Y轴,Excel.XlAxisType.xlCategory对应的是X轴:
Excel.Axis valueAxis = (Excel.Axis)xlChart.Axes(Excel.XlAxisType.xlValue, XlAxisGroup.xlPrimary);
valueAxis.AxisTitle.Orientation = -90;
Excel.Axis categoryAxis = (Excel.Axis)xlChart.Axes(Excel.XlAxisType.xlCategory, XlAxisGroup.xlPrimary);
categoryAxis.AxisTitle.Font.Name = "MS UI Gothic";
到此,一切就绪了,下面要生成Chart,并将其存为一个Excel文件:
 try
try

 {
{ ThisApplication = new Excel.Application(); m_objBooks = (Excel.Workbooks)ThisApplication.Workbooks; ThisWorkbook = (Excel._Workbook)(m_objBooks.Add(Type.Missing)); ThisApplication.DisplayAlerts = false; this.DeleteSheet(); this.AddDatasheet(); this.LoadData(); CreateChart(); ThisWorkbook.SaveAs("z://Book2.xls", Type.Missing, Type.Missing, Type.Missing, Type.Missing, Type.Missing, Excel.XlSaveAsAccessMode.xlNoChange, Type.Missing, Type.Missing, Type.Missing, Type.Missing);
 }catch (Exception ex){ MessageBox.Show(ex.Message);}finally{ ThisWorkbook.Close(Type.Missing, Type.Missing, Type.Missing); ThisApplication.Workbooks.Close(); ThisApplication.Quit(); System.Runtime.InteropServices.Marshal.ReleaseComObject(ThisWorkbook); System.Runtime.InteropServices.Marshal.ReleaseComObject(ThisApplication); ThisWorkbook = null; ThisApplication = null; GC.Collect(); this.Close();}
运行你的程序,打开生成的Excel文件,最终生成的Chart应该像这样:
完成了Chart的生成,但是上面对于每个月只有一项数据,如果我想显示多项呢,例如显示每个月两个页面的范围量的对比。方法很简单,只要再多生成一组数据就可以了,我们修改下LoadData方法:
private void LoadData()
{
Random ran = new Random();
for (int i = 1; i <= 12; i++)
{
xlSheet.Cells[i, 1] = i.ToString() + "月";
xlSheet.Cells[i, 2] = ran.Next(2000).ToString();
xlSheet.Cells[i, 3] = ran.Next(1500).ToString();
}
}
再次运行程序,生成Chart看看,应该像下面的效果:
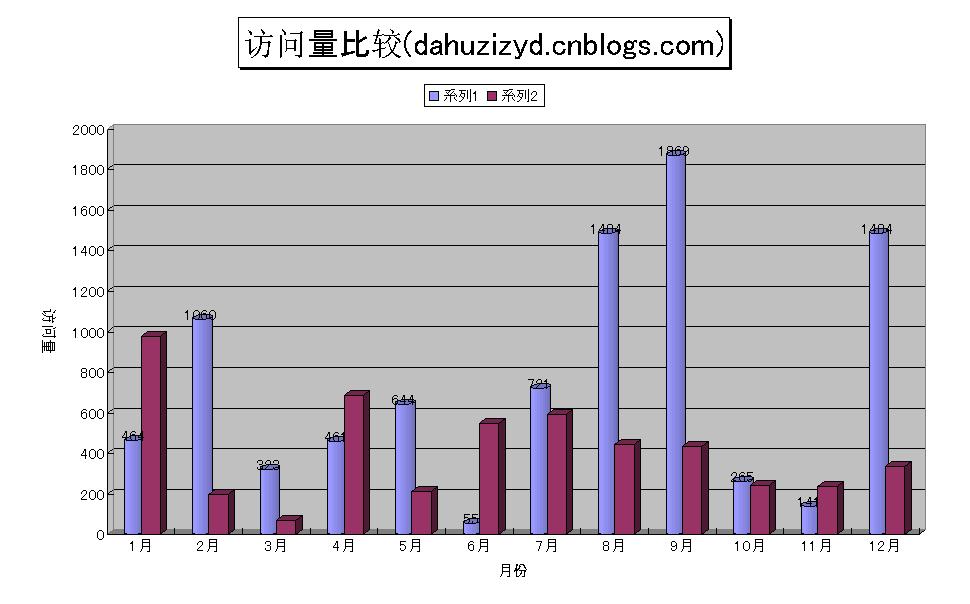
可以看到,两组数据以不同的形状显示,同时,图例部分也不再显示1-12月共12项,而是显示两项,这是因为在上面的代码中我们设置了ChartGroup的VaryByCategories 属性:
grp.VaryByCategories = true;当我们有两个以上的组时,这一项就失效了。
在用C#操作Excel的时候,恐怕最大的困难就在于不知道Excel提供的各个对象,以及它们的属性,方法等信息,好在MSDN里有关于Excel的接口说明-Excel Primary Interop Assembly Reference,参照这些,相信很快就能上手了。
最后是完整代码:
private void button4_Click(object sender, EventArgs e){ try
 { ThisApplication = new Excel.Application(); m_objBooks = (Excel.Workbooks)ThisApplication.Workbooks; ThisWorkbook = (Excel._Workbook)(m_objBooks.Add(Type.Missing)); ThisApplication.DisplayAlerts = false; this.DeleteSheet(); this.AddDatasheet(); this.LoadData(); CreateChart(); ThisWorkbook.SaveAs("z://Book2.xls", Type.Missing, Type.Missing, Type.Missing, Type.Missing, Type.Missing, Excel.XlSaveAsAccessMode.xlNoChange, Type.Missing, Type.Missing, Type.Missing, Type.Missing);
 } catch (Exception ex) { MessageBox.Show(ex.Message); } finally { ThisWorkbook.Close(Type.Missing, Type.Missing, Type.Missing); ThisApplication.Workbooks.Close(); ThisApplication.Quit(); System.Runtime.InteropServices.Marshal.ReleaseComObject(ThisWorkbook); System.Runtime.InteropServices.Marshal.ReleaseComObject(ThisApplication); ThisWorkbook = null; ThisApplication = null; GC.Collect(); this.Close(); }}Excel.Application ThisApplication = null;Excel.Workbooks m_objBooks = null;Excel._Workbook ThisWorkbook = null;Excel.Worksheet xlSheet = null;/**//// <summary>/// 用生成的随机数作数据/// </summary>private void LoadData(){ Random ran = new Random(); for (int i = 1; i <= 12; i++) { xlSheet.Cells[i, 1] = i.ToString() + "月"; xlSheet.Cells[i, 2] = ran.Next(2000).ToString(); }}/**//// <summary>/// 删除多余的Sheet/// </summary>private void DeleteSheet(){ foreach (Excel.Worksheet ws in ThisWorkbook.Worksheets) if (ws != ThisApplication.ActiveSheet) { ws.Delete(); } foreach (Excel.Chart cht in ThisWorkbook.Charts) cht.Delete(); }/**//// <summary>/// 创建一个Sheet,用来存数据/// </summary>private void AddDatasheet(){ xlSheet = (Excel.Worksheet)ThisWorkbook. Worksheets.Add(Type.Missing, ThisWorkbook.ActiveSheet, Type.Missing, Type.Missing); xlSheet.Name = "数据";}/**//// <summary>/// 创建统计图 /// </summary>private void CreateChart(){ Excel.Chart xlChart = (Excel.Chart)ThisWorkbook.Charts. Add(Type.Missing, xlSheet, Type.Missing, Type.Missing); Excel.Range cellRange = (Excel.Range)xlSheet.Cells[1, 1]; xlChart.ChartWizard(cellRange.CurrentRegion, Excel.XlChartType.xl3DColumn, Type.Missing, Excel.XlRowCol.xlColumns,1, 0, true , "访问量比较(dahuzizyd.cnblogs.com)", "月份", "访问量", ""); xlChart.Name = "统计"; Excel.ChartGroup grp = (Excel.ChartGroup)xlChart.ChartGroups(1);grp.GapWidth = 20; grp.VaryByCategories = true; Excel.Series s = (Excel.Series)grp.SeriesCollection(1); s.BarShape = XlBarShape.xlCylinder; s.HasDataLabels = true; xlChart.Legend.Position = XlLegendPosition.xlLegendPositionTop; xlChart.ChartTitle.Font.Size = 24; xlChart.ChartTitle.Shadow = true; xlChart.ChartTitle.Border.LineStyle = Excel.XlLineStyle.xlContinuous; Excel.Axis valueAxis = (Excel.Axis)xlChart.Axes(Excel.XlAxisType.xlValue, XlAxisGroup.xlPrimary); valueAxis.AxisTitle.Orientation = -90; Excel.Axis categoryAxis = (Excel.Axis)xlChart.Axes(Excel.XlAxisType.xlCategory, XlAxisGroup.xlPrimary); categoryAxis.AxisTitle.Font.Name = "MS UI Gothic";}
- 使用C#和Excel进行报表开发(三)-生成统计图(Chart)
- 使用C#和Excel进行报表开发(三)-生成统计图(Chart)
- 使用C#和Excel进行报表开发(三)-生成统计图(Chart)
- 使用C#和Excel进行报表开发(三)-生成统计图(Chart)
- 使用C#和Excel进行报表开发(三)-生成统计图(Chart)
- 使用C#和Excel进行报表开发(三)-生成统计图(Chart)
- 使用C#和Excel进行报表开发(三)-生成统计图(Chart)
- 使用C#和Excel进行报表开发(三)-生成统计图(Chart)
- 使用C#和Excel进行报表开发(三)-生成统计图(Chart)
- 使用C#和Excel进行报表开发(三)-生成统计图(Chart)1
- 使用C#和Excel进行报表开发(三)-生成统计图(Chart)2
- 使用C#和Excel进行报表开发(三)-生成统计图(Chart)3
- 使用C#和Excel进行报表开发(三)-生成统计图(Chart)4
- 使用C#和Excel进行报表开发(三)-生成统计图(Chart)5
- 使用C#和Excel进行报表开发(二)-操作统计图(Chart)
- 使用C#和Excel进行报表开发(二)-操作统计图(Chart)
- 使用C#和Excel进行报表开发(二)-操作统计图(Chart)
- 使用C#和Excel进行报表开发(二)-操作统计图(Chart)
- 指针
- 将Excel应用于报表开发中(一)--开始
- 用五年时间跨越鸿沟
- 使用C#和Excel进行报表开发(二)-操作统计图(Chart)
- 关于毕业论文(设计)撰写和装订格式的说明
- 使用C#和Excel进行报表开发(三)-生成统计图(Chart)
- 使用C#和Excel进行报表开发(四)-复制单元格
- 使用C#和Excel进行报表开发(五)-操作单元格边框和颜色
- 使用C#和Excel进行报表开发(六)-操作行和列
- 使用C#和Excel进行报表开发(七)-设置单元格的显示格式
- Java语言入门级的十二大特色详细介绍 转自天极
- tomcat 数据源配置文件
- 教你如何成为一名Java初级程序员 转自天极
- 紫川----绝对好书