Tracing mysqld Using DTrace
来源:互联网 发布:java幂等性 编辑:程序博客网 时间:2024/06/15 11:42
本文章转载自:http://dev.mysql.com/doc/refman/5.5/en/dba-dtrace-server.html
Tracing mysqld Using DTrace
[+/-]
- 5.4.1 mysqld DTrace Probe Reference
The DTrace probes in the MySQL server are designed to provide information about the execution of queries within MySQL and the different areas of the system being utilized during that process. The organization and triggering of the probes means that the execution of an entire query can be monitored with one level of probes (query-startand query-done) but by monitoring other probes you can get successively more detailed information about the execution of the query in terms of the locks used, sort methods and even row-by-row and storage-engine level execution information.
The DTrace probes are organized so that you can follow the entire query process, from the point of connection from a client, through the query execution, row-level operations, and back out again. You can think of the probes as being fired within a specific sequence during a typical client connect/execute/disconnect sequence, as shown in the following figure.
Figure 5.1 The MySQL Architecture Using Pluggable Storage Engines
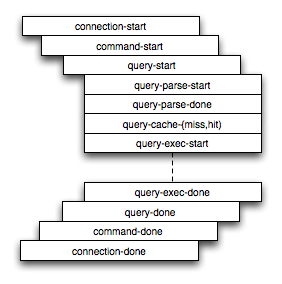
Global information is provided in the arguments to the DTrace probes at various levels. Global information, that is, the connection ID and user/host and where relevant the query string, is provided at key levels (connection-start, command-start, query-start, and query-exec-start). As you go deeper into the probes, it is assumed either you are only interested in the individual executions (row-level probes provide information on the database and table name only), or that you will combine the row-level probes with the notional parent probes to provide the information about a specific query. Examples of this will be given as the format and arguments of each probe are provided.
For more information on DTrace and writing DTrace scripts, read the DTrace User Guide.
MySQL 5.5 includes support for DTrace probes on Solaris 10 Update 5 (Solaris 5/08) on SPARC, x86 and x86_64 platforms. Probes are also supported on Mac OS X 10.4 and higher. Enabling the probes should be automatic on these platforms. To explicitly enable or disable the probes during building, use the -DENABLE_DTRACE=1 or -DENABLE_DTRACE=0 option to CMake.
If a non-Solaris platform includes DTrace support, building mysqld on that platform will include DTrace support.
注:近期参加MySQL运维学习,老师推荐该文章作为学习和技术提高的扩展阅读,先记录到自己的博客中,随后慢慢消化、学习、提高。本文与MySQL数据库 “安装部署”主题有关。
- Tracing mysqld Using DTrace
- DTrace即动态跟踪Dynamic Tracing
- Process Tracing Using Ptrace
- Process Tracing Using Ptrace
- DTrace
- 分享一篇文章《Using DTrace to Instrument Your System》
- Troubleshooting Failed Requests Using Tracing in IIS 7
- DTrace简介
- Tracing Sessions in Oracle Using the DBMS_SUPPORT Package (文档 ID 62160.1)
- How to generate Oracle Net tracing for a DBMS_JOB using a database link
- DTrace: pid provider
- Demo'ing DTrace
- DTrace Graphical User Interface
- Top 10 Dtrace scripts
- dtrace查询函数调用
- Dtrace VS truss
- Tutorial: DTrace by Example
- dtrace的使用
- 对比iOS网络组件:AFNetworking VS ASIHTTPRequest
- 重口味笑话
- 完美解决 未能打开编辑器:Unmatched braces in the pattern.
- String StringBuilder StringBuffer 对比 总结得非常好
- 英国税务海关总署咬子弹和拥抱服务追债和哲学
- Tracing mysqld Using DTrace
- Exchange Server 2003 防垃圾邮件设定
- 华为测试 求小球落地5次后所经历的路程和第5次反弹的高度
- 网站博客创建了神奇的博客
- 安卓开发的问题
- ado.net 各个数据库链接字符串
- TPC Benchmarks
- 苹果拿下新合约: 北卡州建第三个数据中心
- Varnish – 高性能http加速器


User Comments
Posted by Amit Saha on April 27 2009 3:50am[Delete] [Edit]Refer to http://dev.mysql.com/tech-resources/articles/getting_started_dtrace_saha.html for a getting started style document for DTracing MySQL