xampp+phpStorm+Xdebug
来源:互联网 发布:东方卫视直播软件 编辑:程序博客网 时间:2024/04/30 12:53
朋友给推荐了phpStorm但安装之后觉得功能很强大,就试着去搞搞。
之前安装了appserver,但找到的资料写的是xampp,于是就下载了XAMPP,但不会用啊,Apache服务,mysql服务还有冲突,于是就找师兄帮忙。
先关闭了Appserver的apache服务和mysql服务。
将XAMPP的apache和mysql安装的服务卸掉,变成了X。(开机时候不会启动)然后start
- 服务器端(本地调试的情况下就是在本机)安装好XAMPP,停止apache服务(注意,如果直接退出XAMPP,是不会停止apache的)
- 在安装目录下找到php.ini,类似于D:\xampp\php\php.ini,并打开
- 找到被注释掉的项目并按如下设置:
- [XDebug]zend_extension = "D:\xampp\php\ext\php_xdebug.dll";xdebug.profiler_append = 0;xdebug.profiler_enable = 1;xdebug.profiler_enable_trigger = 0;xdebug.profiler_output_dir = "D:\xampp\tmp";xdebug.profiler_output_name = "cachegrind.out.%t-%s"xdebug.remote_enable = 1xdebug.remote_handler = "dbgp"xdebug.remote_host = "127.0.0.1";xdebug.trace_output_dir = "D:\xampp\tmp"xdebug.remote_mode = "req"xdebug.remote_port = 9000
其中remote_host 是指调试客户端的地址,即IDE所在的IP,同理remote_port 是客户端的端口,这两项在远程调试的情况下注意修改
- 保存文件,打开apache,这时候在CMD里输入 D:\xampp\php\php.exe -m 看到XDebug,说明开启成功。至此,服务器端配置完毕
- 下面是客户端调试,打开phpStorm,进入File>Settings>PHP>Servers,这里要填写服务器端的相关信息,name填localhost,host填localhost,port填80,debugger选XDebug
- 进入File>Settings>PHP>Debug,看到XDebug选项卡,port填9000,其他默认
- 进入File>Settings>PHP>Debug>DBGp Proxy,IDE key 填 phpStorm,host 填localhost,port 填80
- 点OK退出设置。
配置浏览器
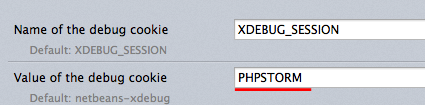
Firefox浏览器可以安装 easy Xdebug ,Chrome上安装 Xdebug helper 。安装好后,在IDE Key 上填上 PHPSTORM (需要和配置一样)即可。
Firefox 下的 easy Xdebug 配置:
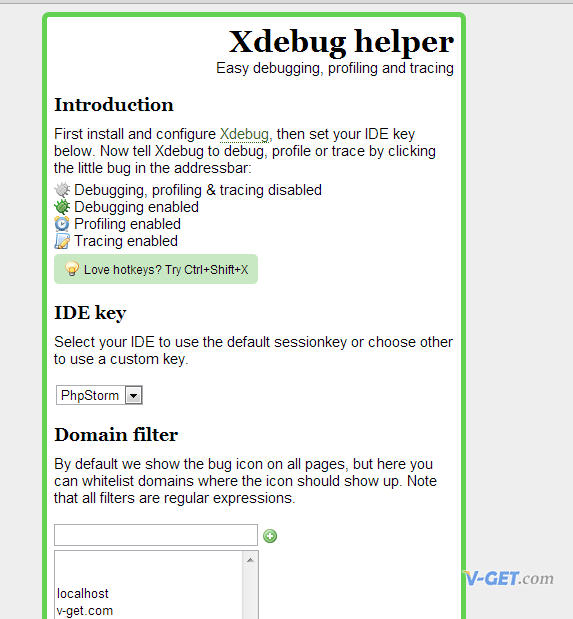
Chrome 下的 Xdebug helper 配置:
开始DEBUG
设置完成后,在PHPStorm里添加相应的断点,然后用刚配置好的浏览器访问相应页面,首次打开PHPStorm会提示是否接收来自PHP所在服务器的连接。如下图,Debugger窗口已经出现了调试信息: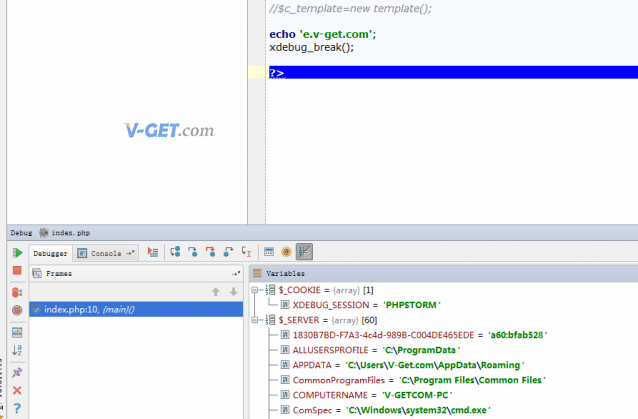
PHPStorm Xdebug 显示
When configuring the PHP interpreter for our project, PhpStorm will inform us if a debugger is installed and will yield the Xdebug or Zend Debugger version used.

From the Settings | Project Settings | PHP | Servers window, we can validate our debugger setup using the Validate Remote Environmentbutton.
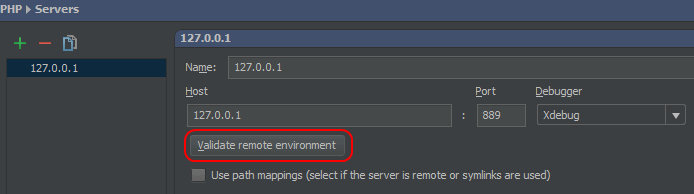
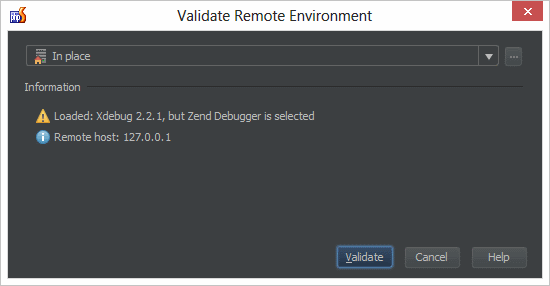
This will open a new window where we can test the deployment environment on which we want to attach the debugger and validate the debugger configuration. This deployment environment can be “In place”, e.g. a local webserver or a remote server which is accessible by PhpStorm. Once we click Validate, PhpStorm will tell us if anything is missing (and what). Note that it can do that for both Xвebug and Zend Debugger.

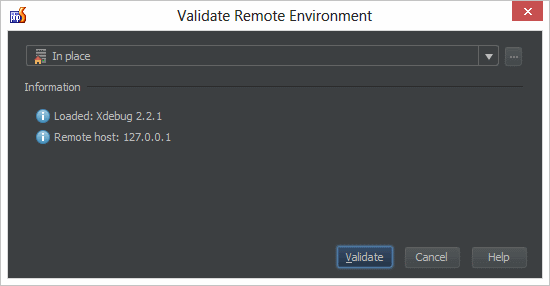
There we are! I missed xdebug.remote_enable again. If we select different options in PhpStorm from our deployment environment, Debugger Validation Configuration will detect that:
If we’ve configured everything correctly, PhpStorm will be happy to tell:
This new feature will save some time trying to figure out what is wrong with the debugger configuration. Give PhpStorm 7 EAP a try and as always, let us hear your thoughts in the issue tracker, through the comments below or in our forums!
自己的配置
http://www.cnblogs.com/xuxiang/p/3512560.html
http://blog.csdn.net/meegomeego/article/details/25729205
http://blog.jetbrains.com/phpstorm/2013/08/debugger-configuration-validation-with-phpstorm/
http://solf.me/debug-php-with-xdebug-in-phpstorm/
感谢!
- xampp+phpStorm+Xdebug
- 配置 Phpstorm + Xdebug + xampp
- XAMPP+phpStorm+XDebug+Chrome
- PhpStorm+Xampp+Xdebug配置
- PhpStorm+Xampp+Xdebug配置
- netbeans phpstorm 通过 xampp xdebug 开启单步调试
- 本地环境 XAMPP+phpStorm+XDebug+chrome 配置和断点调试
- 本地环境 XAMPP+phpStorm+XDebug+chrome 配置和断点调试
- 转载:史上最全在xampp与phpstorm环境下安装xdebug
- 本地环境 XAMPP+phpStorm+XDebug+chrome 配置和断点调试
- 本地环境 XAMPP+phpStorm+XDebug+chrome 配置和断点调试
- 本地环境 XAMPP+phpStorm+XDebug+chrome 配置和断点调试
- PhpStorm+Xdebug+XAMPP组合搭建PHP调试环境
- 本地环境 XAMPP+phpStorm+XDebug+chrome 配置和断点调试
- 本地环境 XAMPP+phpStorm+XDebug+chrome配置和断点调试
- 在xampp与phpstorm环境下安装xdebug
- phpstorm+Xdebug断点调试PHP(xampp自带)
- Mac下PHP-XAMPP-PhpStorm-Xdebug断点调试配置
- linux超级终端minicom的使用方法
- nehe第十一课飘动的旗帜waving texture实现原理
- Java读取properties文件
- 2014-7-11-VS-项目文件右击属性-如果较新则复制的作用
- opencv 2.x学习笔记(六) 扫描、遍历图像
- xampp+phpStorm+Xdebug
- asp.net用三层实现多条件检索示例
- hai de nver 155nver55522797
- Linux内存管理(上)
- 2.Maintainence
- 多项式运算C++版
- Java利用MessageDigest获取字符串或文件MD5详解
- SVN中tag branch trunk用法详解
- C++ vector初始化二维数组与其迭代器